
Video lessons
Each method explained with an everyday analogy, then shown live in Python and in Excel.
Course 6 of 6 · The Data Analytics pathway
AB Testing & Machine Learning
Move from "what happened?" to "how sure are we, and what should we do?" Test claims, run and read A/B tests, forecast and use basic machine learning in Python and Excel, turning every result into a decision for the fictional Kettle & Bean team.
Free preview lesson
What you will learn
Who it is for
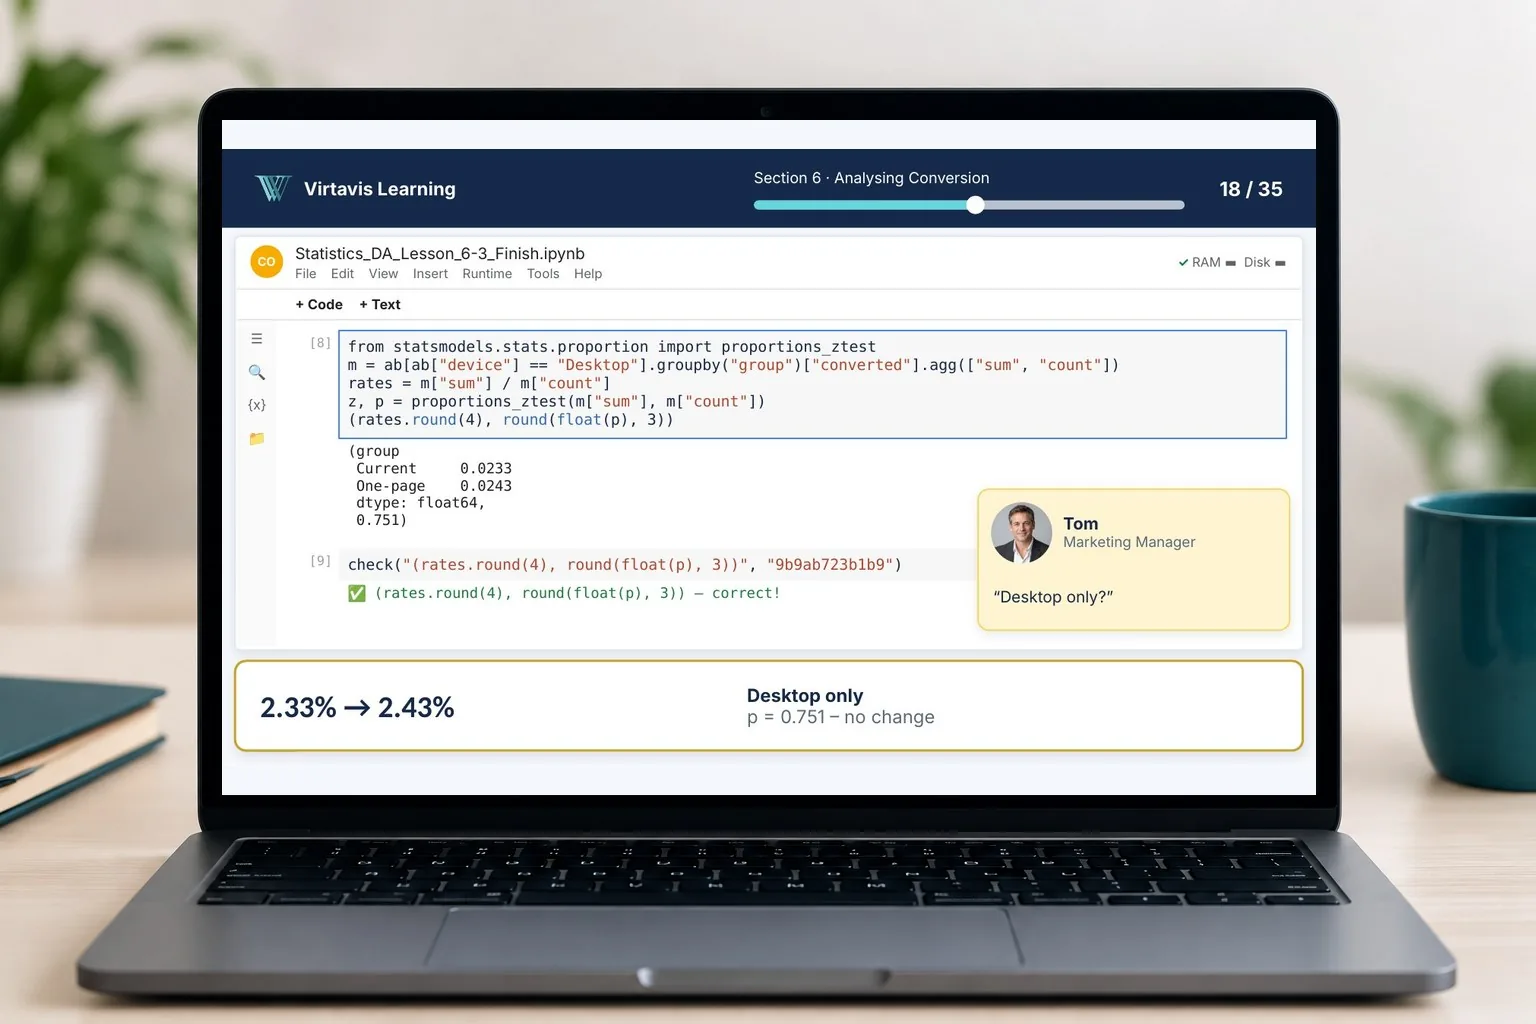
A free Google account for Google Colab, and Microsoft 365 desktop Excel with the Analysis ToolPak. Machine learning lessons are Python only. No statistics or Python experience is needed: lesson 1.5 is a pandas quick start.
What's included
Each method explained with an everyday analogy, then shown live in Python and in Excel.
A handbook for every section, so you can review the ideas and examples at your own pace.
Short checks at the end of each section to confirm you have understood the key ideas.
A challenge brief to work through on your own in each section, then a solution walkthrough to compare your work with.
The shared company data plus new tables for the methods: web sessions, an A/B test, ad and email spend and a customer survey.
Every statistic is shown in both, so you can use the one your workplace uses.
Inside the handbook
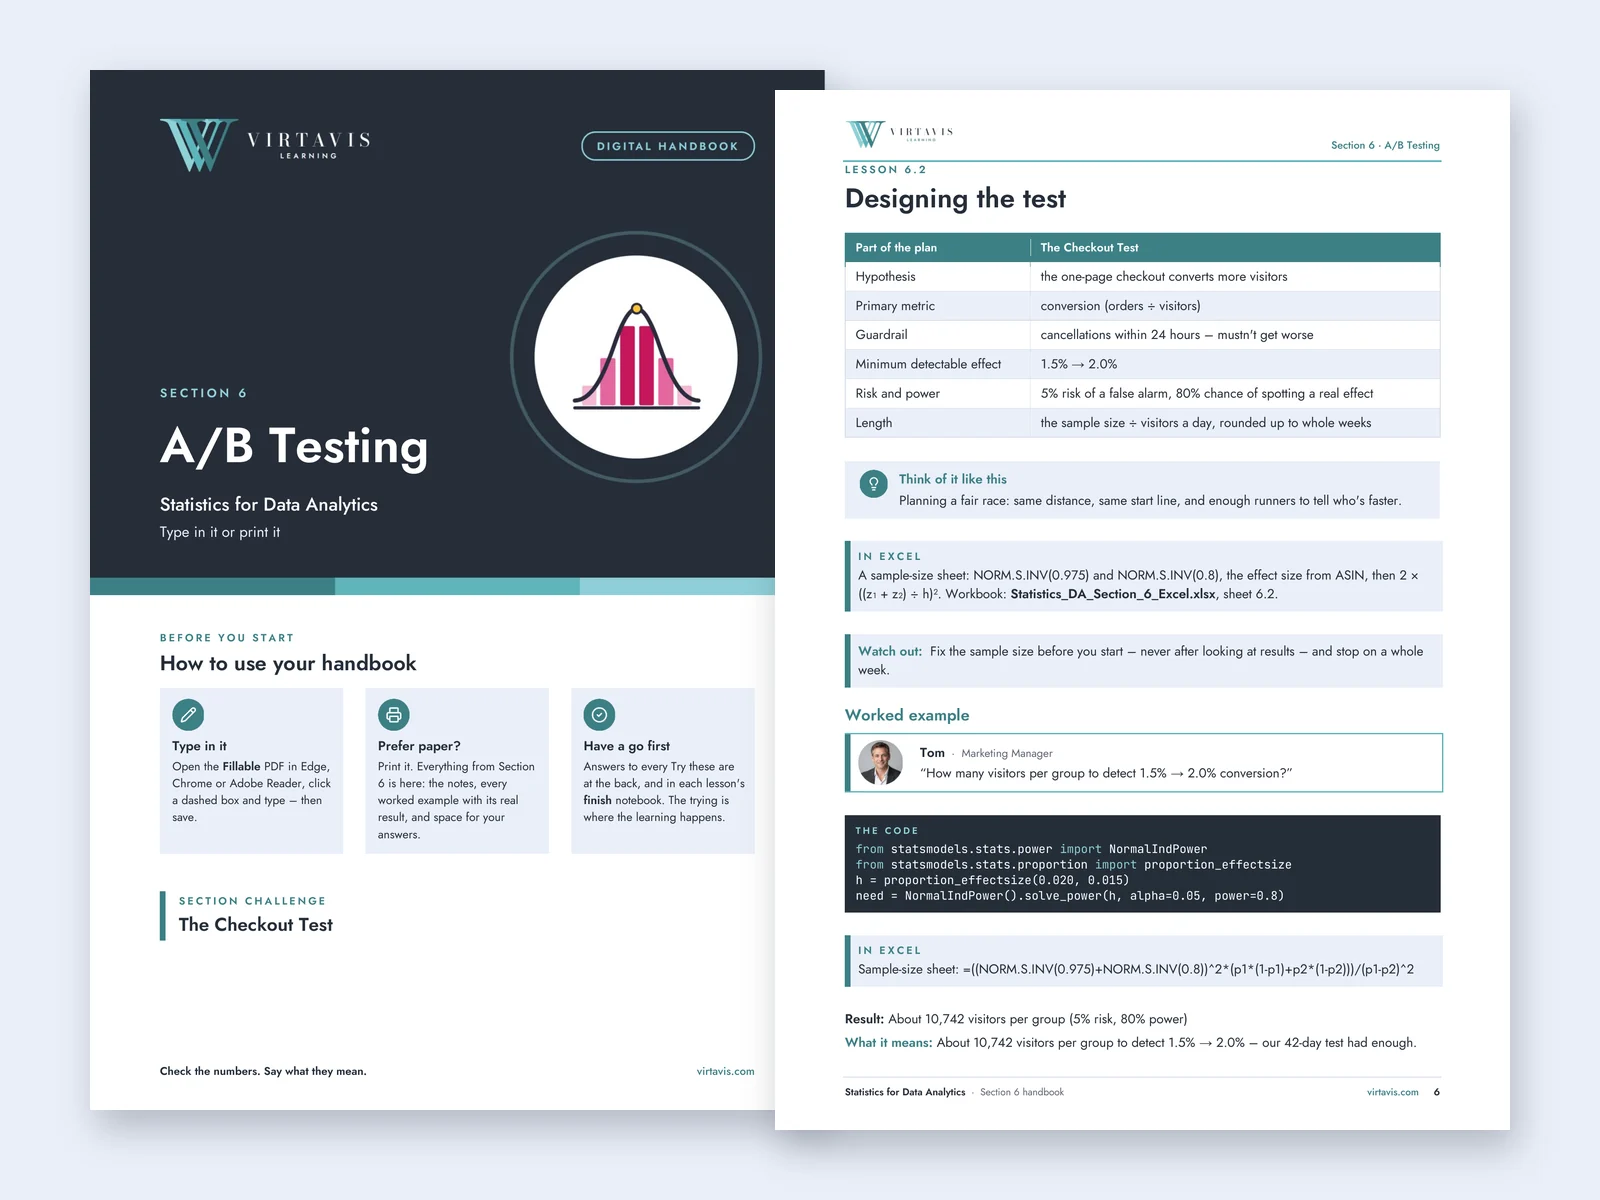
Each section has its own handbook with the notes, analogies, every worked example with its real result, and space for your answers. Type in the fillable PDF or print it.
Shown: the Section 6 cover and the Lesson 6.2 page on designing the test.
Course content
Scope a request, choose the right KPI and method, and get started in Colab and Excel.
Choose the right average, measure spread and shape, and investigate outliers.
Measure funnels and team KPIs, and spot vanity metrics.
Work with samples, the normal distribution and confidence intervals.
Choose and run the right test, and read correlation without assuming cause.
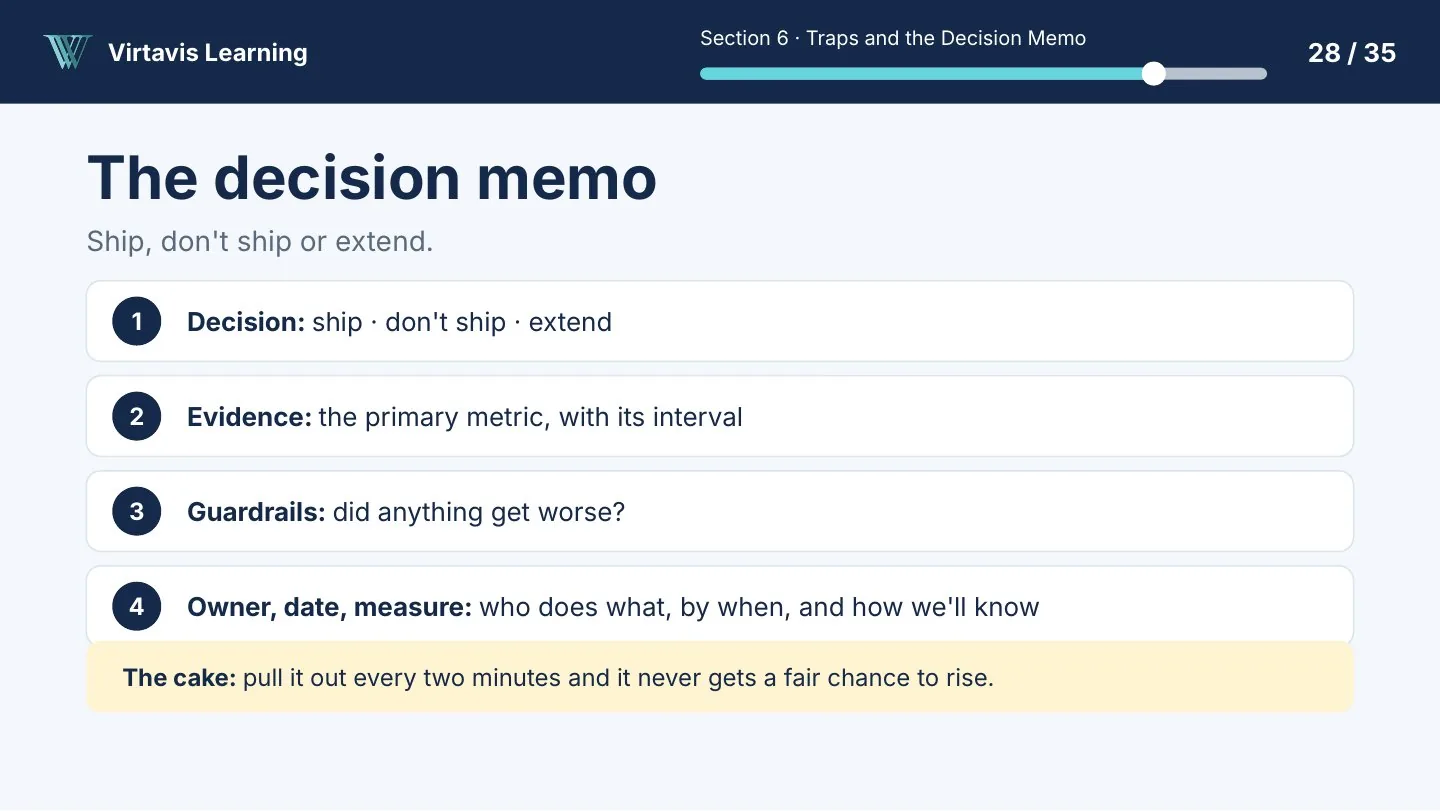
Plan, analyse and decide on an A/B test, and write the decision memo.
Model what drives results and forecast against a baseline.
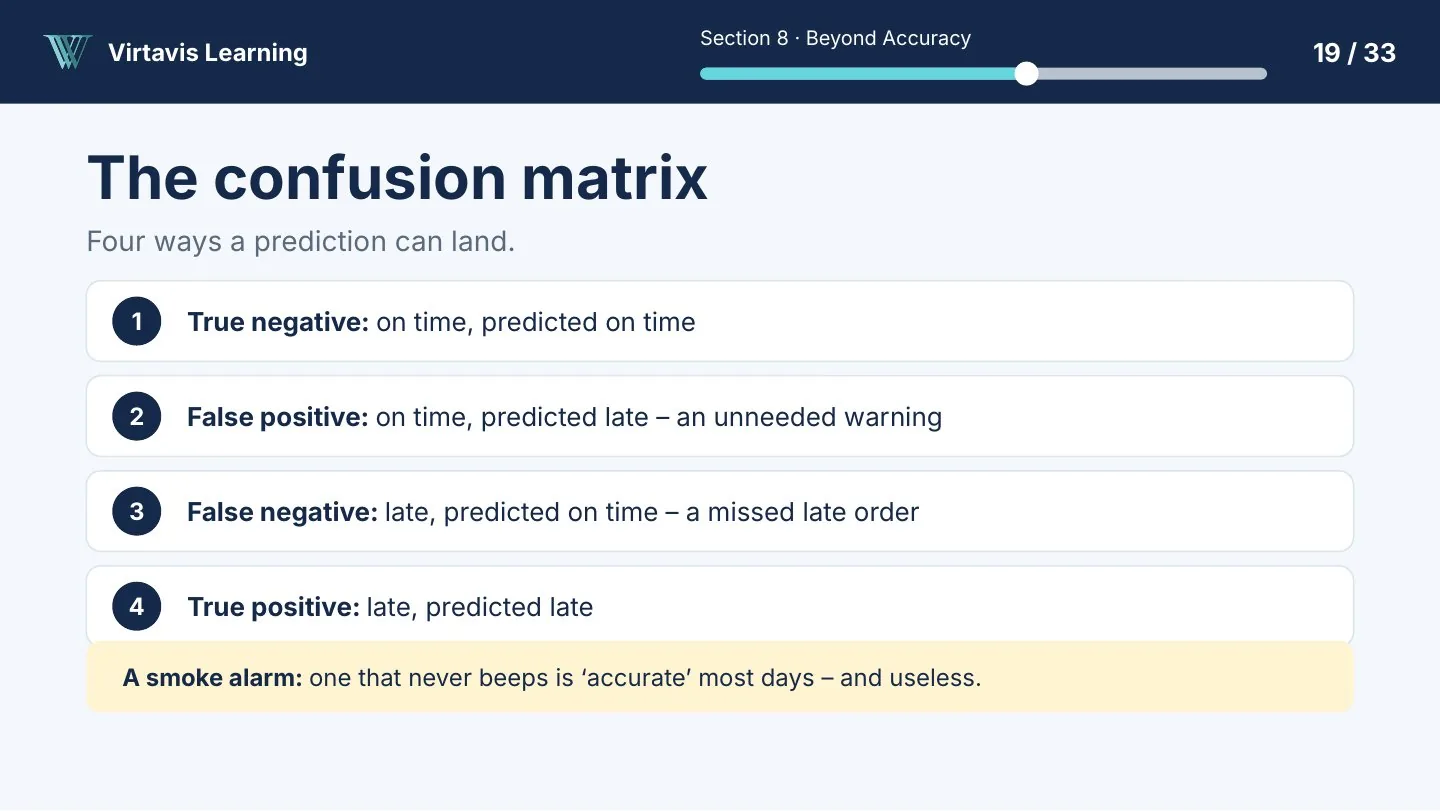
Build and evaluate a simple classifier, and read a confusion matrix.
Segment customers with k-means, check AI's answers and complete the growth plan.
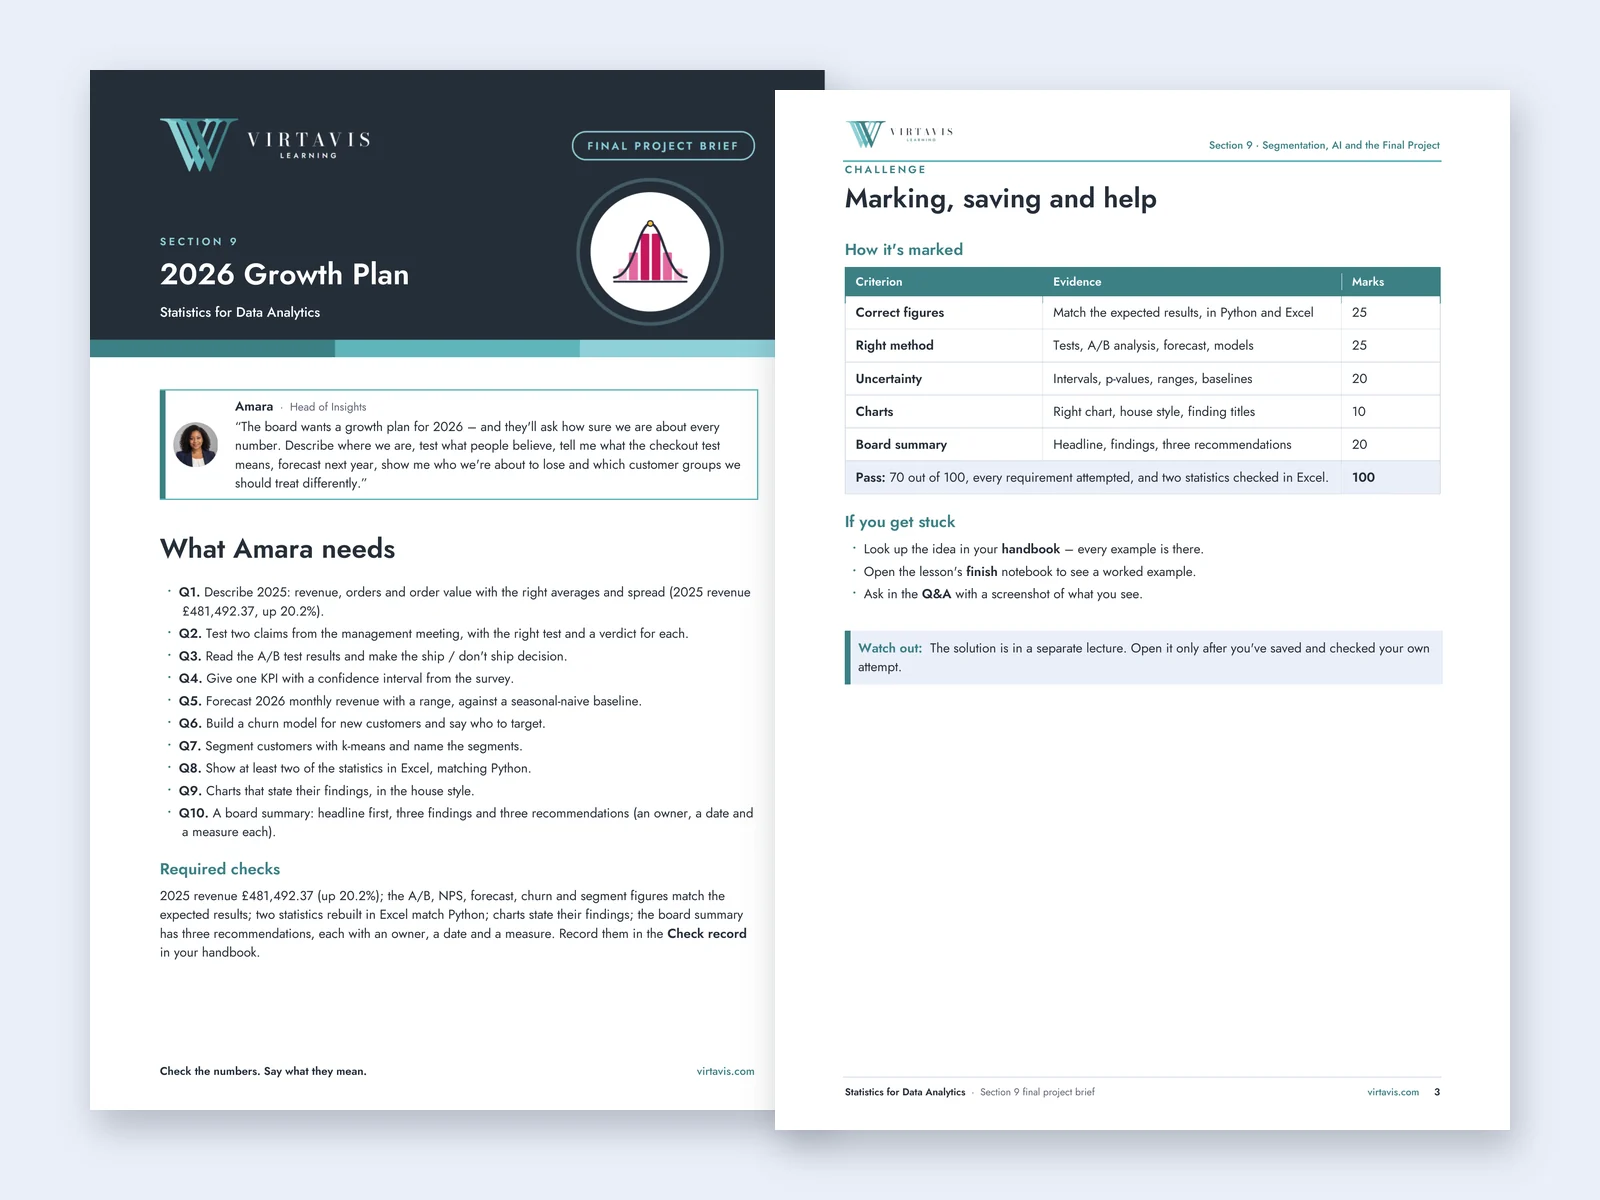
In Section 9 you describe 2025, test two management claims, read an A/B test and make the ship decision, forecast, predict which customers may not come back and segment customers. You finish with three recommendations for the board, and say how sure you are about each number.
See inside the course
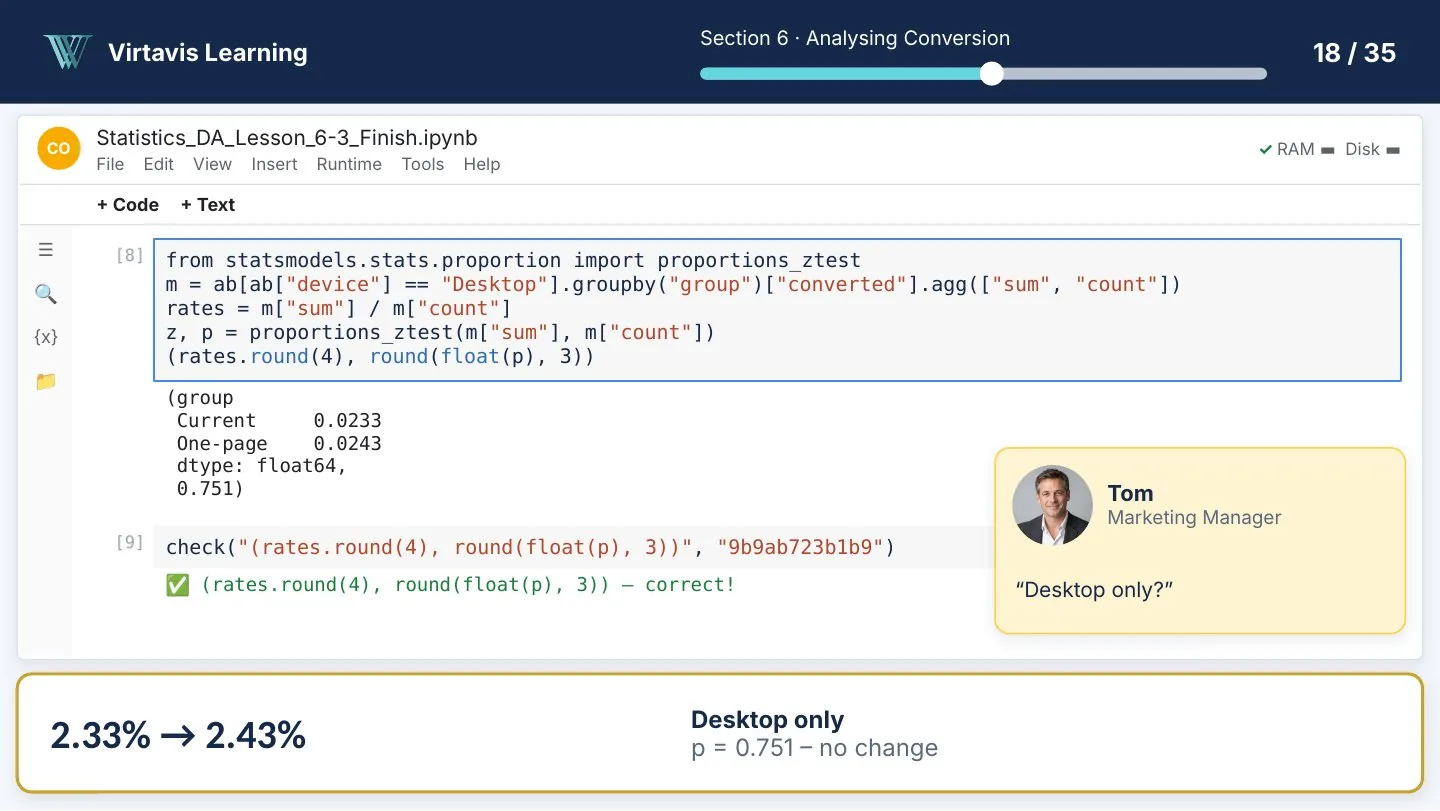
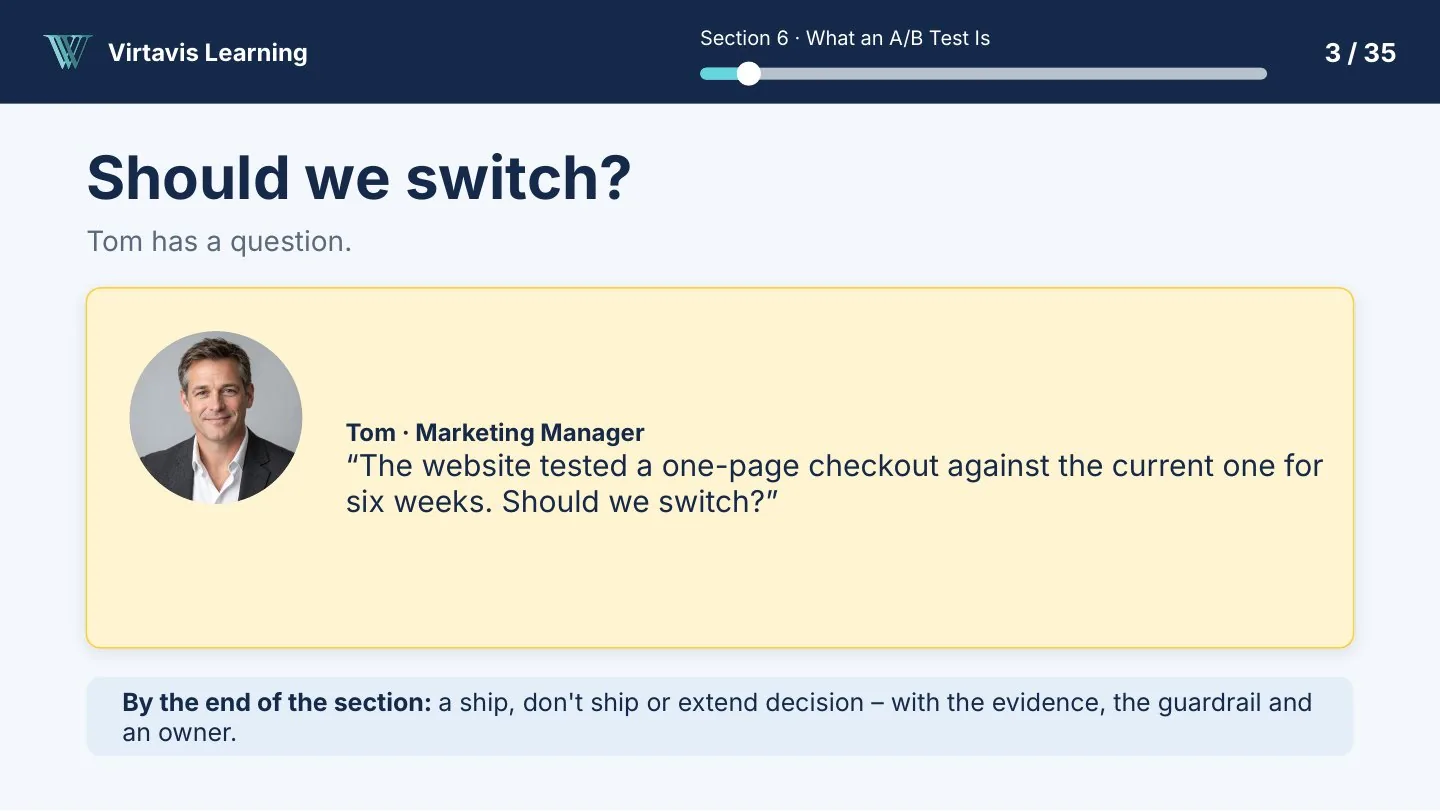
Explore slides from the actual lessons, including the live demonstrations. Click or tap any image to see it full size.
Kettle & Bean Co. is a fictional company created for teaching.
The learning scenario
Each lesson starts with a realistic request from a colleague at a fictional UK coffee and tea retailer. You query the data, check the result and explain what it shows.
 Amara
 Priya
 Grace
 Marcus
 Tom
 Ellie

Created by Virtavis Learning
Data and Business Intelligence Specialist, founder of Virtavis Learning
Sophie Lumpa created this course and designed the Kettle & Bean learning scenario, bringing realistic business questions into the learning experience. The Virtavis teaching team provides additional training and learner support through the Bootcamp and live cohorts.
On the pathway
Questions
If your question isn't answered here, send it to us and the Virtavis team will reply by email.
Contact us ›See how the lessons work before you choose.