Course 2 of 6 · The Data Analytics pathway

Excel for Data Analytics

XLOOKUP, PivotTables & Power Query

Go from opening your first file to building a refreshable business dashboard. Clean data, write formulas, match tables with XLOOKUP, summarise with PivotTables and automate with Power Query to answer questions from the fictional Kettle & Bean team.

View on Udemy ›Get all six in the Bootcamp
  • Course 2 of 6
  • Beginner
  • Microsoft 365 Excel
  • Self-paced
Excel for Data Analytics course thumbnail

Free preview lesson

What you will learn

By the end of the course you can

  • Open CSV files, turn them into Excel Tables, and sort, filter and navigate large data sets.
  • Write formulas with relative and absolute references, number formats and conditional formatting.
  • Clean messy data with text functions, Flash Fill, Text to Columns, date functions and Remove Duplicates.
  • Make decisions with IF and IFS, match data between tables with XLOOKUP, and read VLOOKUP and INDEX / MATCH.
  • Summarise data with SUMIFS, COUNTIFS and SUMPRODUCT, and build PivotTables with slicers and timelines.
  • Automate monthly imports with Power Query and build live lists with FILTER, UNIQUE, SORT and TAKE.
  • Choose the right chart, build Pareto, histogram and combo charts, and plan with Goal Seek and data tables.
  • Design a refreshable one-page dashboard, check it against the source data and present your findings.

Who it is for

This course suits you if

  • You want to use Excel properly for work.
  • You use Excel daily but want to analyse data, not just type it in.
  • You run or manage a business and want clear answers and dashboards from your own data.
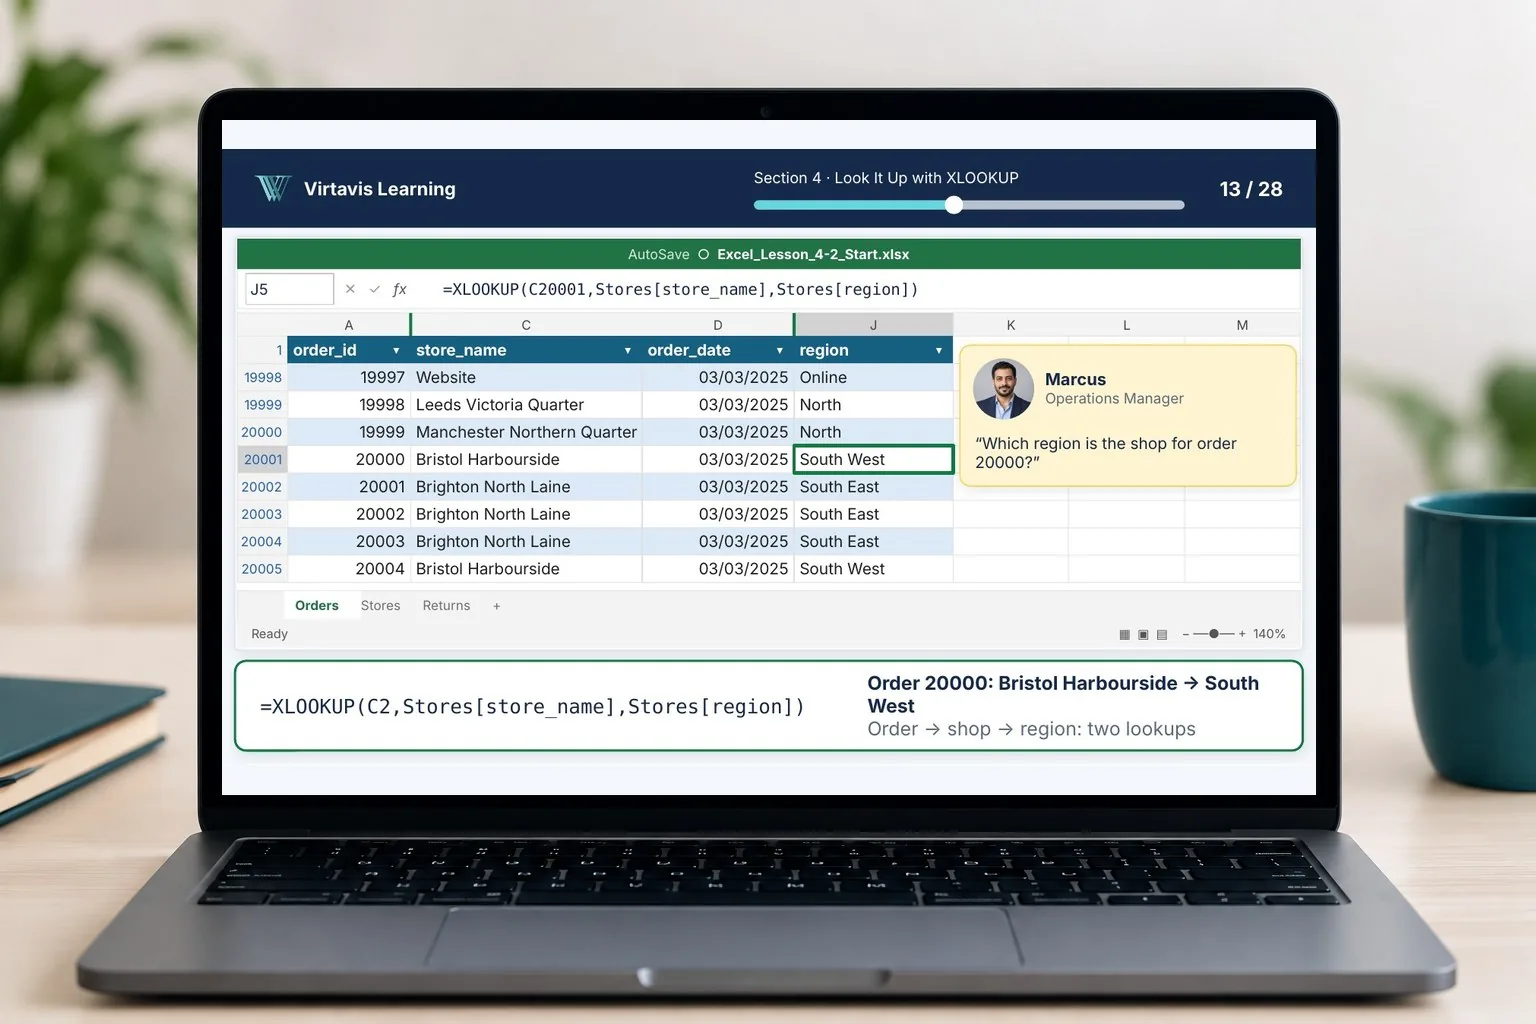
Laptop showing an Excel for Data Analytics live lesson: XLOOKUP finds the region for an order, with a request from Marcus in Operations
You will need

Microsoft 365 desktop Excel on Windows or Mac. Excel for the web and Excel 2021 or earlier are missing some functions and tools the course uses. The course files are a free download in Section 1. No Excel experience is needed.

What's included

Everything in this course

Video lessons

Each tool built step by step in full-screen Excel, with a large formula strip so you can always read what is typed.

Course handbook

A handbook for every section, so you can review the ideas and examples at your own pace.

Quizzes

Short checks at the end of each section to confirm you have understood the key ideas.

Challenges and solution walkthroughs

A challenge brief to work through on your own in each section, then a solution walkthrough to compare your work with.

The Kettle & Bean workbooks

Three years of sales, customer and returns data from the fictional company, with start and finish files for each lesson.

Copilot in Excel, checked

Let AI draft a PivotTable, a chart or a formula, then prove it right against a trusted figure.
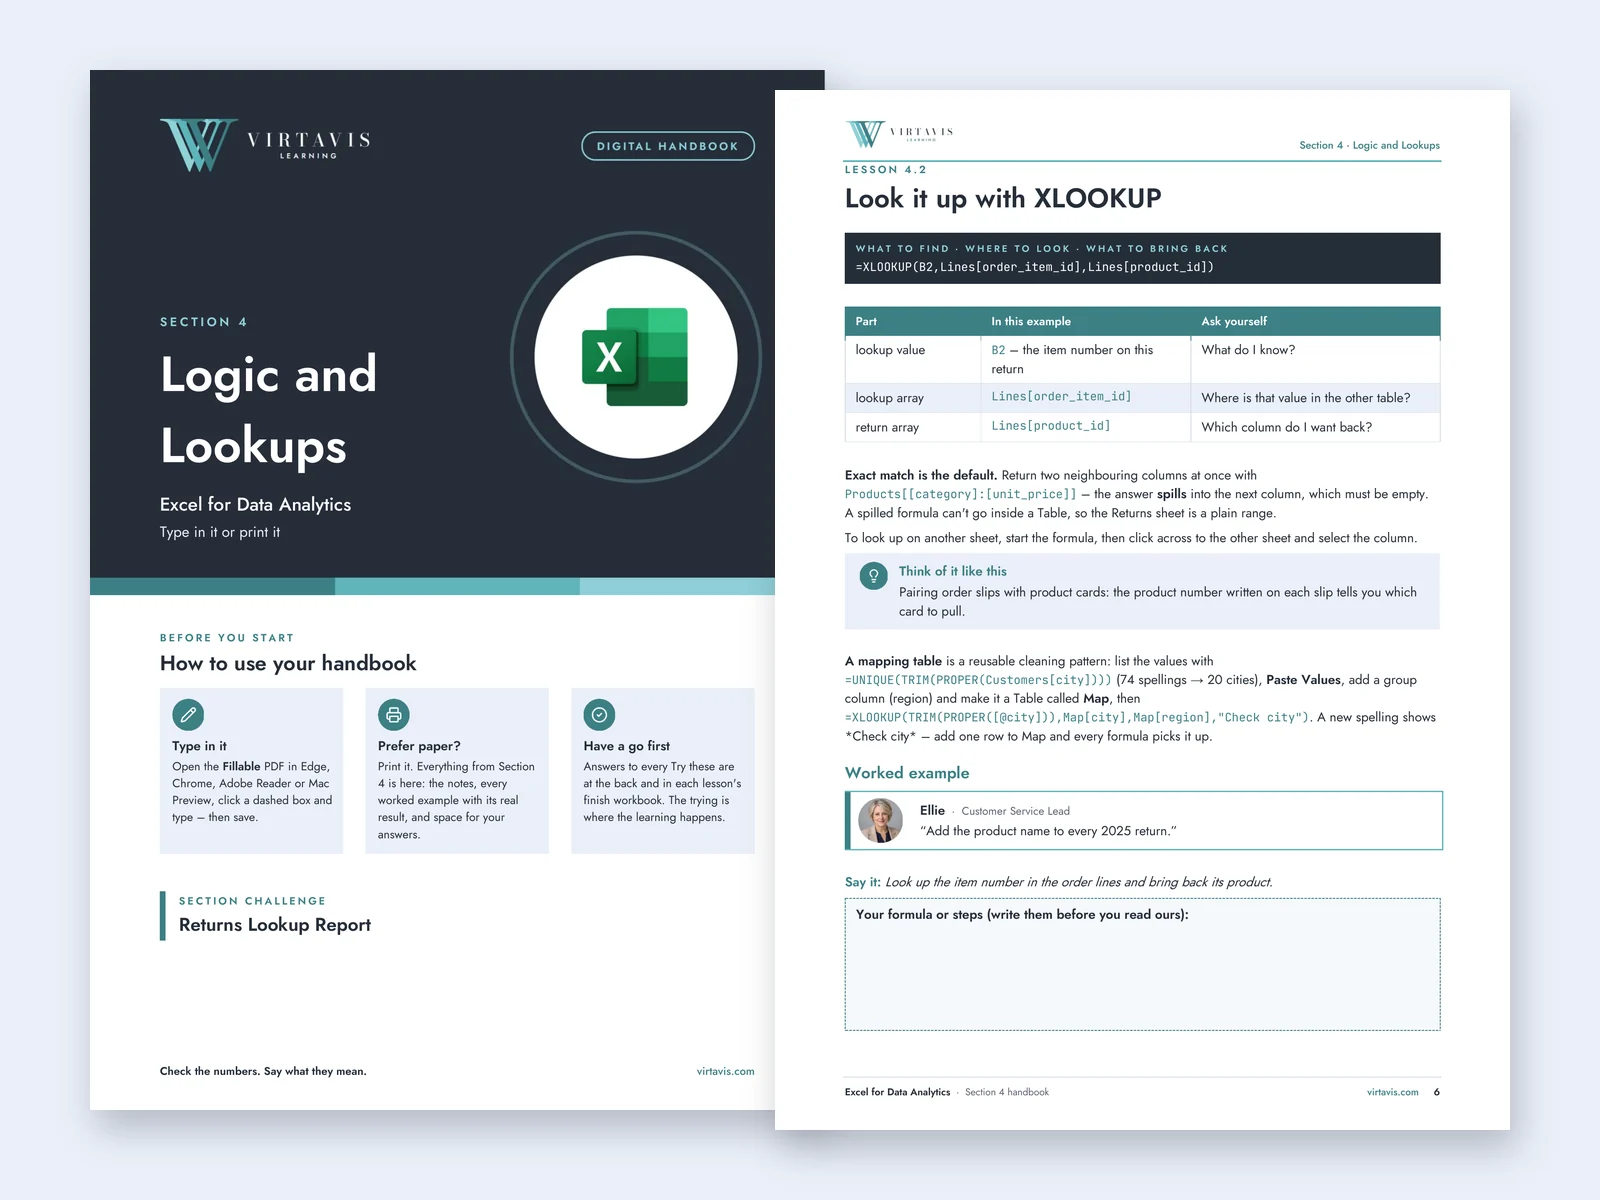
Two pages of the Excel course handbook: the Section 4 Logic and Lookups cover and the Lesson 4.2 page on XLOOKUP

Inside the handbook

A handbook for every section

Each section has its own handbook with the notes, analogies, every worked example with its real result, and space for your answers. Type in the fillable PDF or print it.

Shown: the Section 4 cover and the Lesson 4.2 page on XLOOKUP.

Course content

Eight sections, one final project

  1. 1Section 1

    Welcome to Kettle & Bean in Excel

    Open a CSV, check what arrived, and work with Excel Tables, sort, filter and freeze panes.

  2. 2Section 2

    Formulas and Functions

    Write formulas, copy them with relative and absolute references, round, format and highlight.

  3. 3Section 3

    Cleaning and Preparing Data

    Fix text, split and combine columns, repair dates and remove duplicates the right way.

  4. 4Section 4

    Logic and Lookups

    Make decisions with IF and IFS, look up values with XLOOKUP and handle lookups that fail.

  5. 5Section 5

    Summarising Data

    Use SUMIFS, COUNTIFS and SUMPRODUCT, then build and filter PivotTables.

  6. 6Section 6

    Power Query and Dynamic Arrays

    Clean, append and merge files that refresh, and build live lists with FILTER and SORT.

  7. 7Section 7

    Charts and What-If Analysis

    Choose the right chart, show distributions, and plan with Goal Seek and data tables.

  8. 8Section 8Final project

    Dashboards and Final Project

    Design and check a one-page dashboard, present your findings and use Copilot with checks.

Final project: the 2025 Sales Dashboard

In Section 8 you build a one-page dashboard for Kettle & Bean that refreshes with Power Query, with KPI cards, revenue against target, regional and channel views and a check sheet. You finish with a short summary for the board that explains what the results mean.
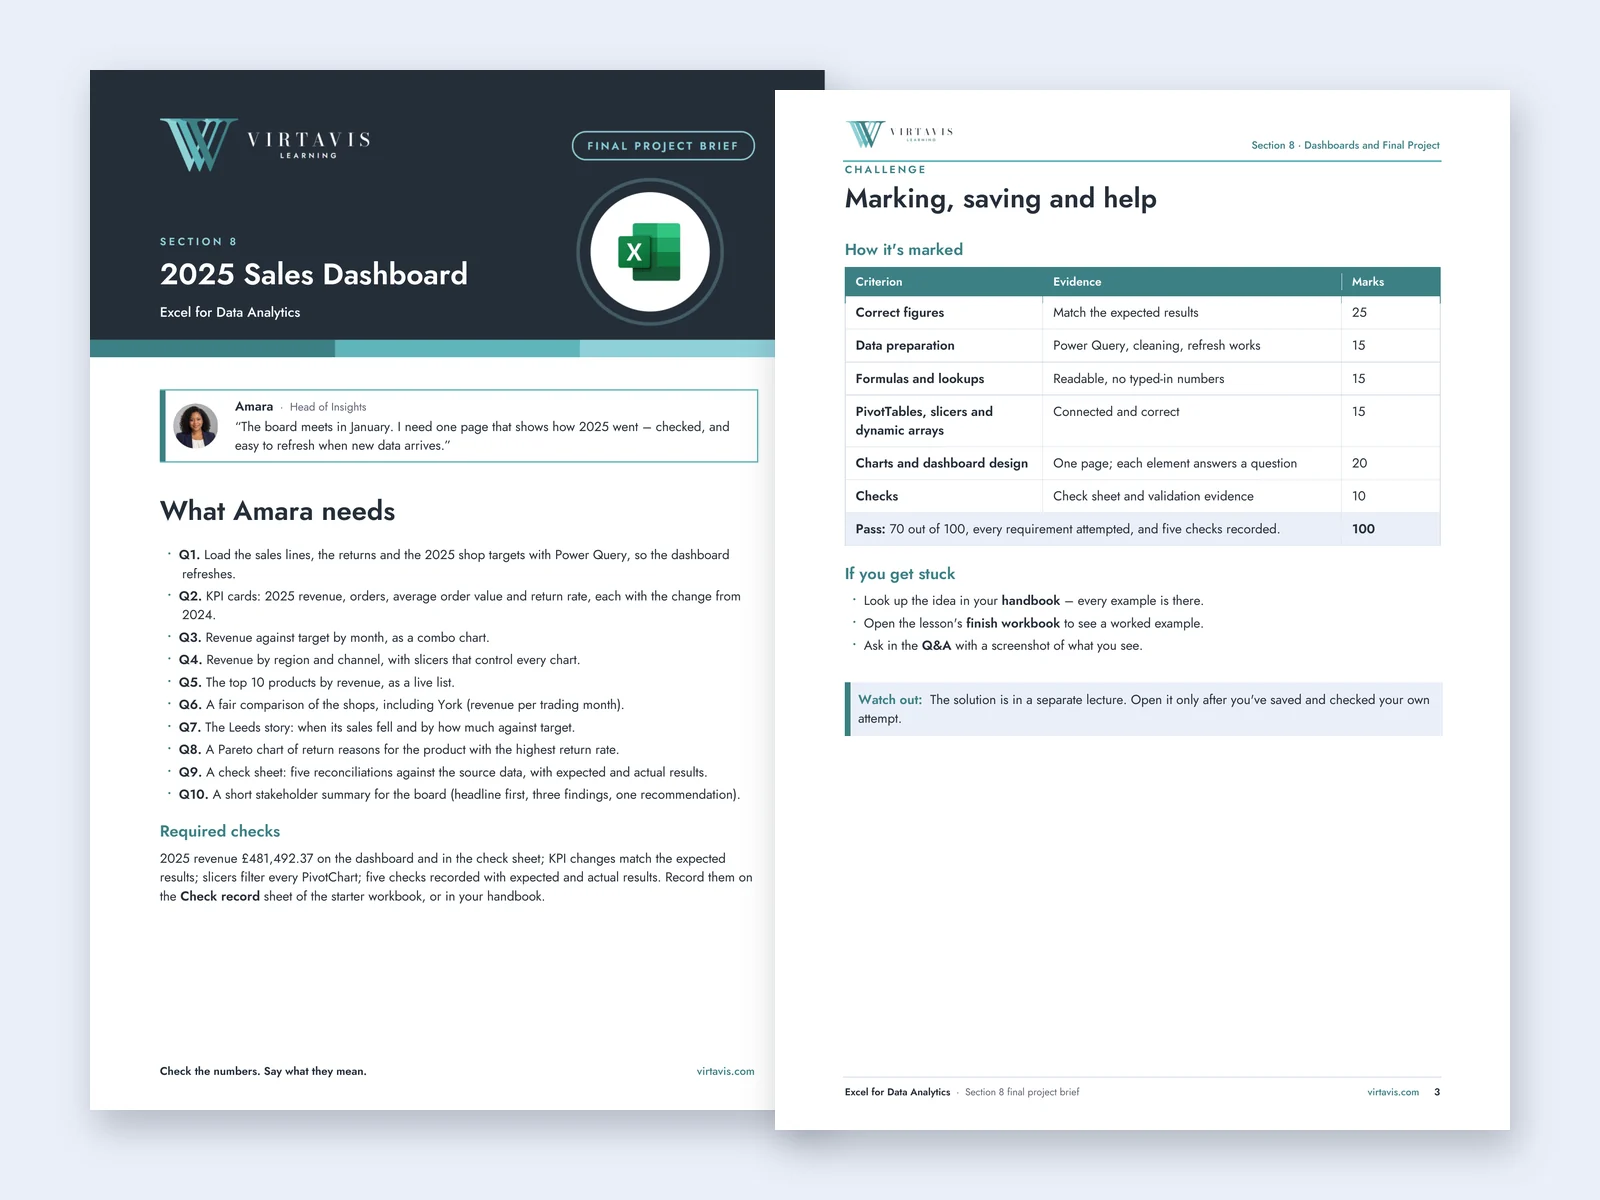
Two pages of the Excel final project brief: Amara's request for a 2025 Sales Dashboard with ten questions, and the marking table

See inside the course

Real formulas, real results

Explore slides from the actual lessons, including the live demonstrations. Click or tap any image to see it full size.
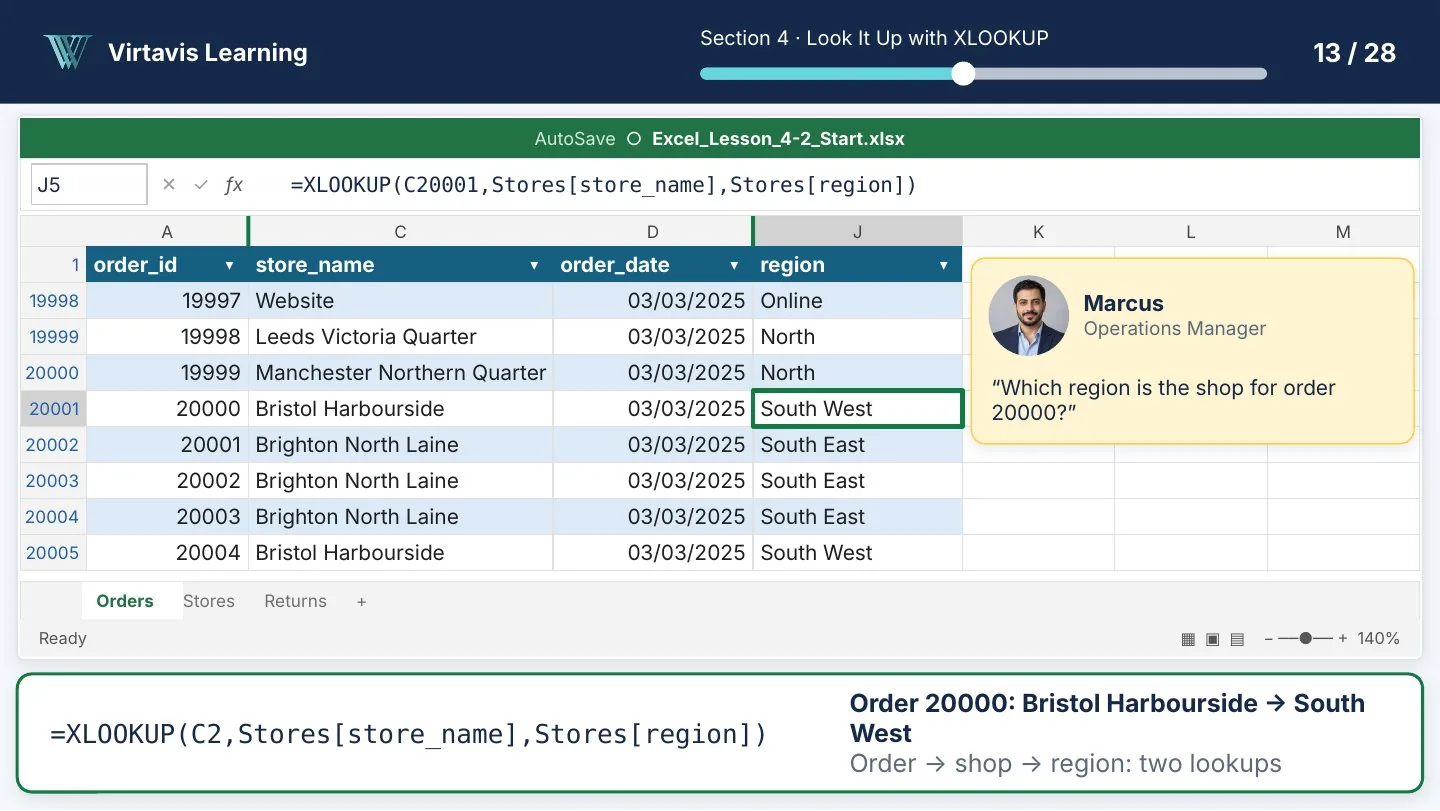
Lesson slide: an XLOOKUP formula in Excel finding the region for an order, with a request from Marcus
Lesson 4.2: Look up each order's region with XLOOKUP, shown live in Excel.
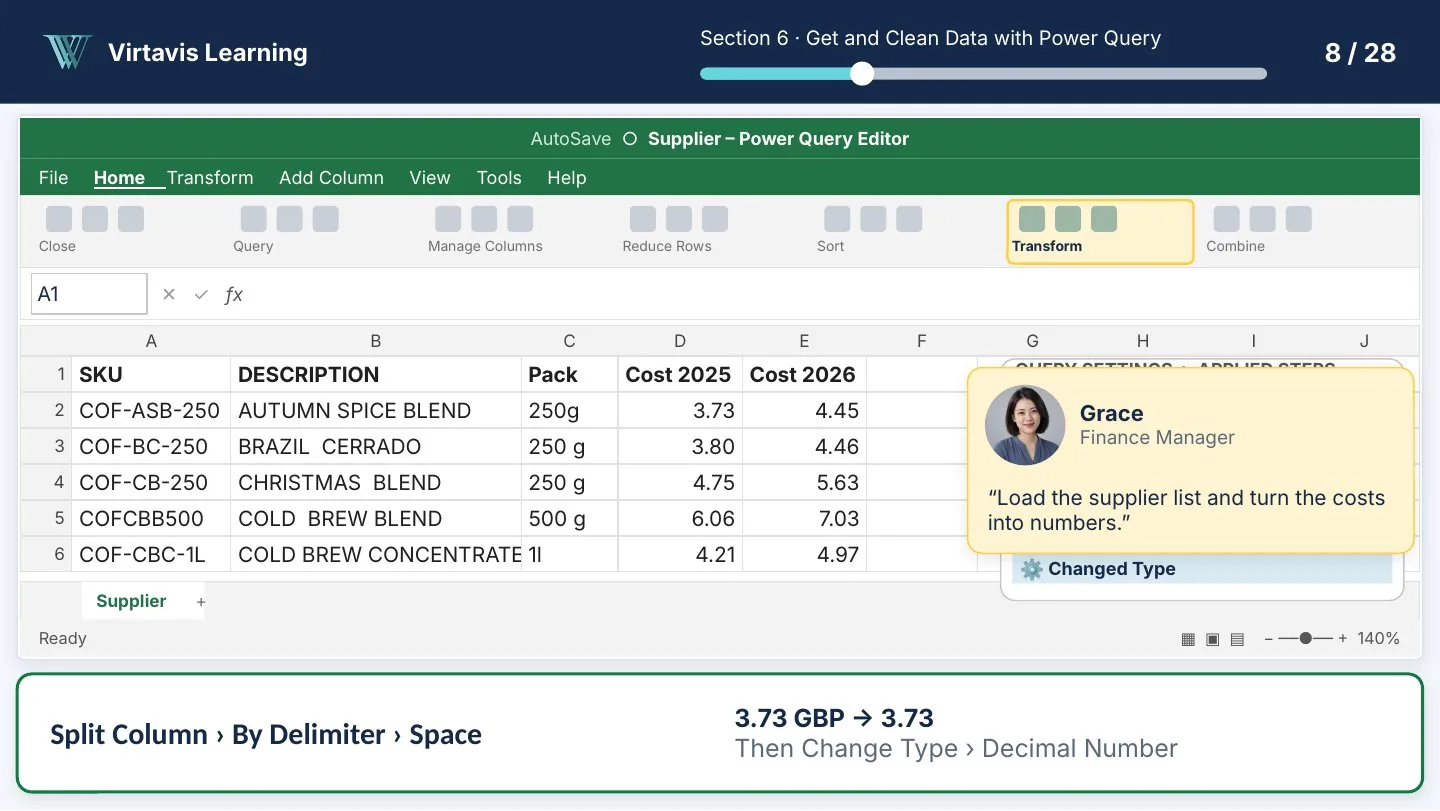
Lesson slide: cleaning a supplier list in the Power Query Editor, with a request from Grace
Section 6: Clean a supplier list in the Power Query Editor.
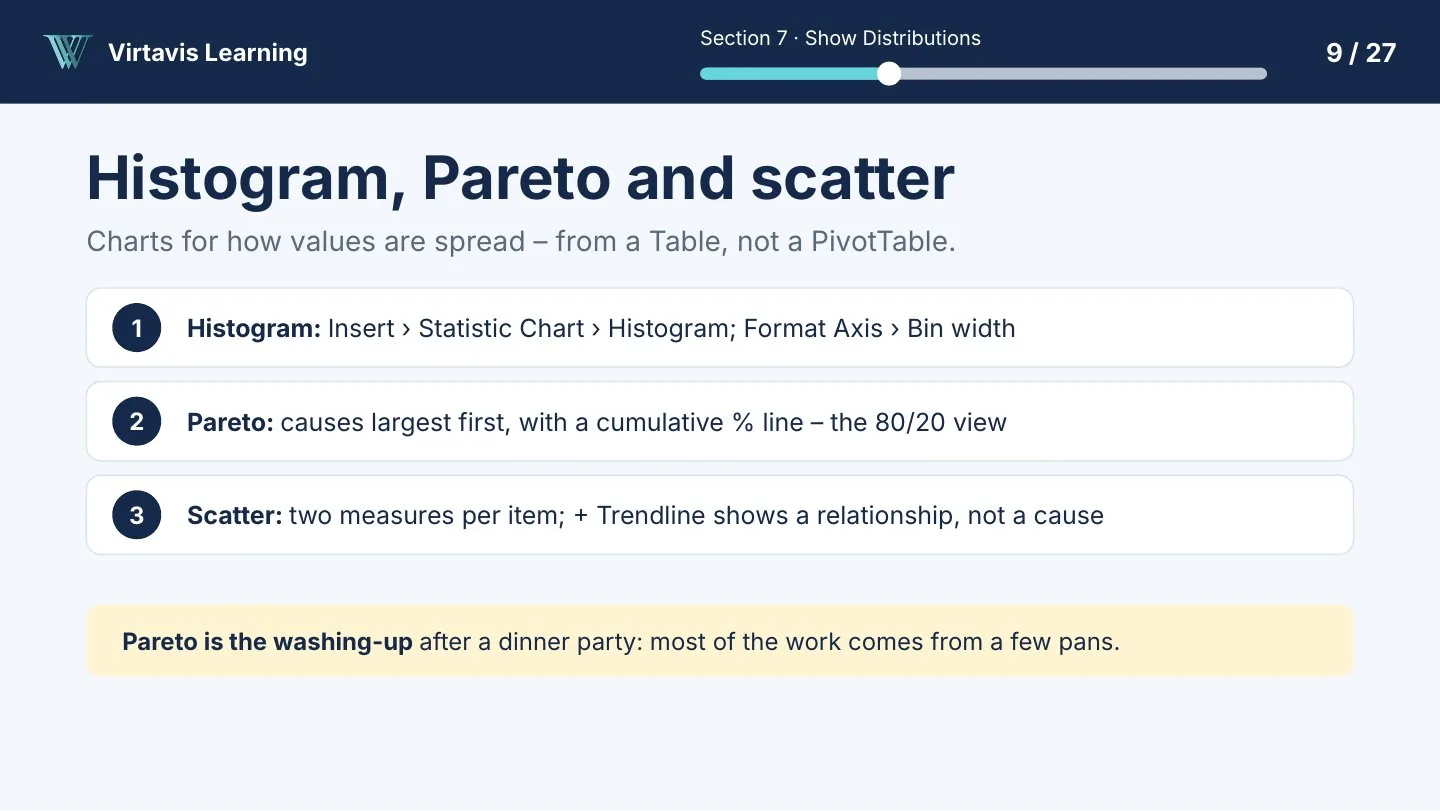
Lesson slide: histogram, Pareto and scatter charts and when to use each
Section 7: Histogram, Pareto and scatter charts.

Kettle & Bean Co. is a fictional company created for teaching.
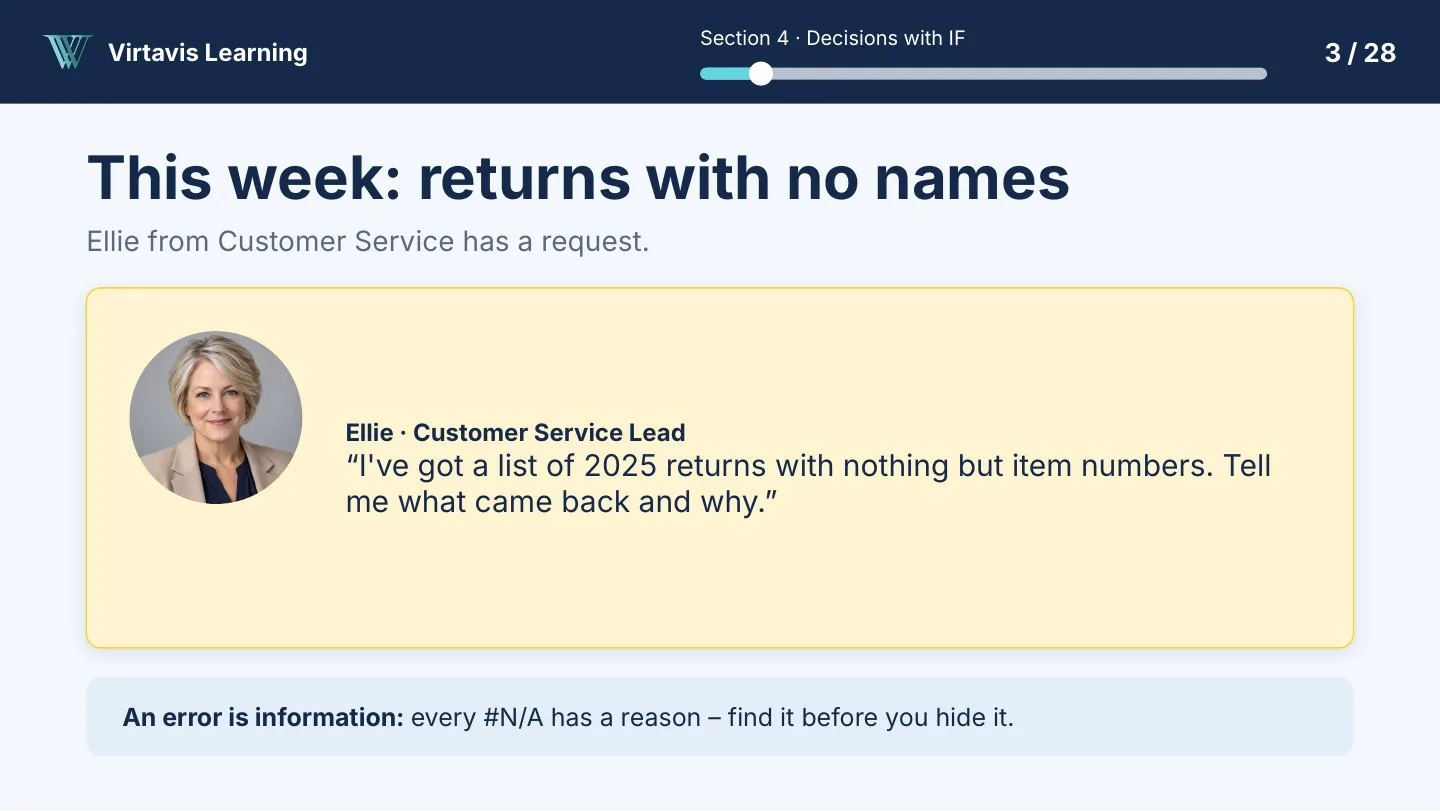
Lesson slide from Section 4: Ellie, Customer Service Lead, has a list of 2025 returns with nothing but item numbers

The learning scenario

Answer questions from the Kettle & Bean team

Each lesson starts with a realistic request from a colleague at a fictional UK coffee and tea retailer. You query the data, check the result and explain what it shows.

  • Amara
    Head of Insights
  • Priya
    Sales
  • Grace
    Finance
  • Marcus
    Operations
  • Tom
    Marketing
  • Ellie
    Customer Service
Watch the free preview ›
Sophie Lumpa

Created by Virtavis Learning

Sophie Lumpa

Data and Business Intelligence Specialist, founder of Virtavis Learning

Sophie Lumpa created this course and designed the Kettle & Bean learning scenario, bringing realistic business questions into the learning experience. The Virtavis teaching team provides additional training and learner support through the Bootcamp and live cohorts.

  • BCS Certified Data Analyst
  • BSc (Hons) Business Management and IT
  • Adult education teaching qualification
  • AgilePM
  • Certified Scrum Master

Questions

Questions about the course?

Something else?

If your question isn't answered here, send it to us and the Virtavis team will reply by email.

Contact us ›
Which version of Excel do I need?
Microsoft 365 desktop Excel on Windows or Mac. Excel for the web and Excel 2021 or earlier are missing some of the functions and tools the course uses, such as the newer dynamic array functions.
Do I need any Excel experience?
No. The course starts with opening a file. It helps to be comfortable using a computer and downloading files.
Where do I buy this course?
On Udemy. The "View on Udemy" button opens the course page, where you can see the current price and terms.
Is it included in the Bootcamp?
Yes. The Virtavis Bootcamp brings all six courses together with the full practice dataset, additional templates and learning resources, and email support. A tutor-supported option is also available with four 30-minute one-to-one sessions, subject to the published package terms.
Does the course use AI?
One lesson shows Copilot in Excel drafting a PivotTable, a chart and a formula, and how to check each answer against a trusted figure. The rest of the course works without Copilot.
Do I get a certificate?
Udemy provides its certificate of completion, subject to its terms. As part of our commitment to delivering high-quality professional learning, we are working towards obtaining CPD accreditation for our courses. We look forward to sharing further updates as we progress.

Start with the free preview.

See how the lessons work before you choose.

View on Udemy ›Explore the Bootcamp