
Course 3 of 6 · The Data Analytics pathway

SQL for Data Analytics

Queries, Joins & KPIs in PostgreSQL

Learn SQL by answering practical business questions. Query a PostgreSQL database, filter and summarise data, join tables, and use subqueries and window functions to investigate questions from the fictional Kettle & Bean team.

View on Udemy ›Get all six in the Bootcamp
  • Course 3 of 6
  • Beginner
  • PostgreSQL
  • Self-paced
SQL for Data Analytics course thumbnail

Free preview lesson

What you will learn

By the end of the course you can

  • Set up PostgreSQL and pgAdmin and write your first SQL queries.
  • Rename columns with AS and filter rows with WHERE to find the records a question needs.
  • Calculate new values, work with text and dates, and round results sensibly.
  • Summarise data with aggregate functions to get totals, counts, averages and other business measures.
  • Connect related tables with INNER JOIN to answer questions across a database.
  • Use subqueries to answer questions that take more than one step.
  • Use window functions to rank results within groups, calculate running totals and track changes over time.
  • Create your own tables, import data and explain what your results show in plain English.

Who it is for

This course suits you if

  • You are new to SQL, or have only seen it in passing.
  • You work with spreadsheets and want to query data directly.
  • You want practice on a realistic business database.
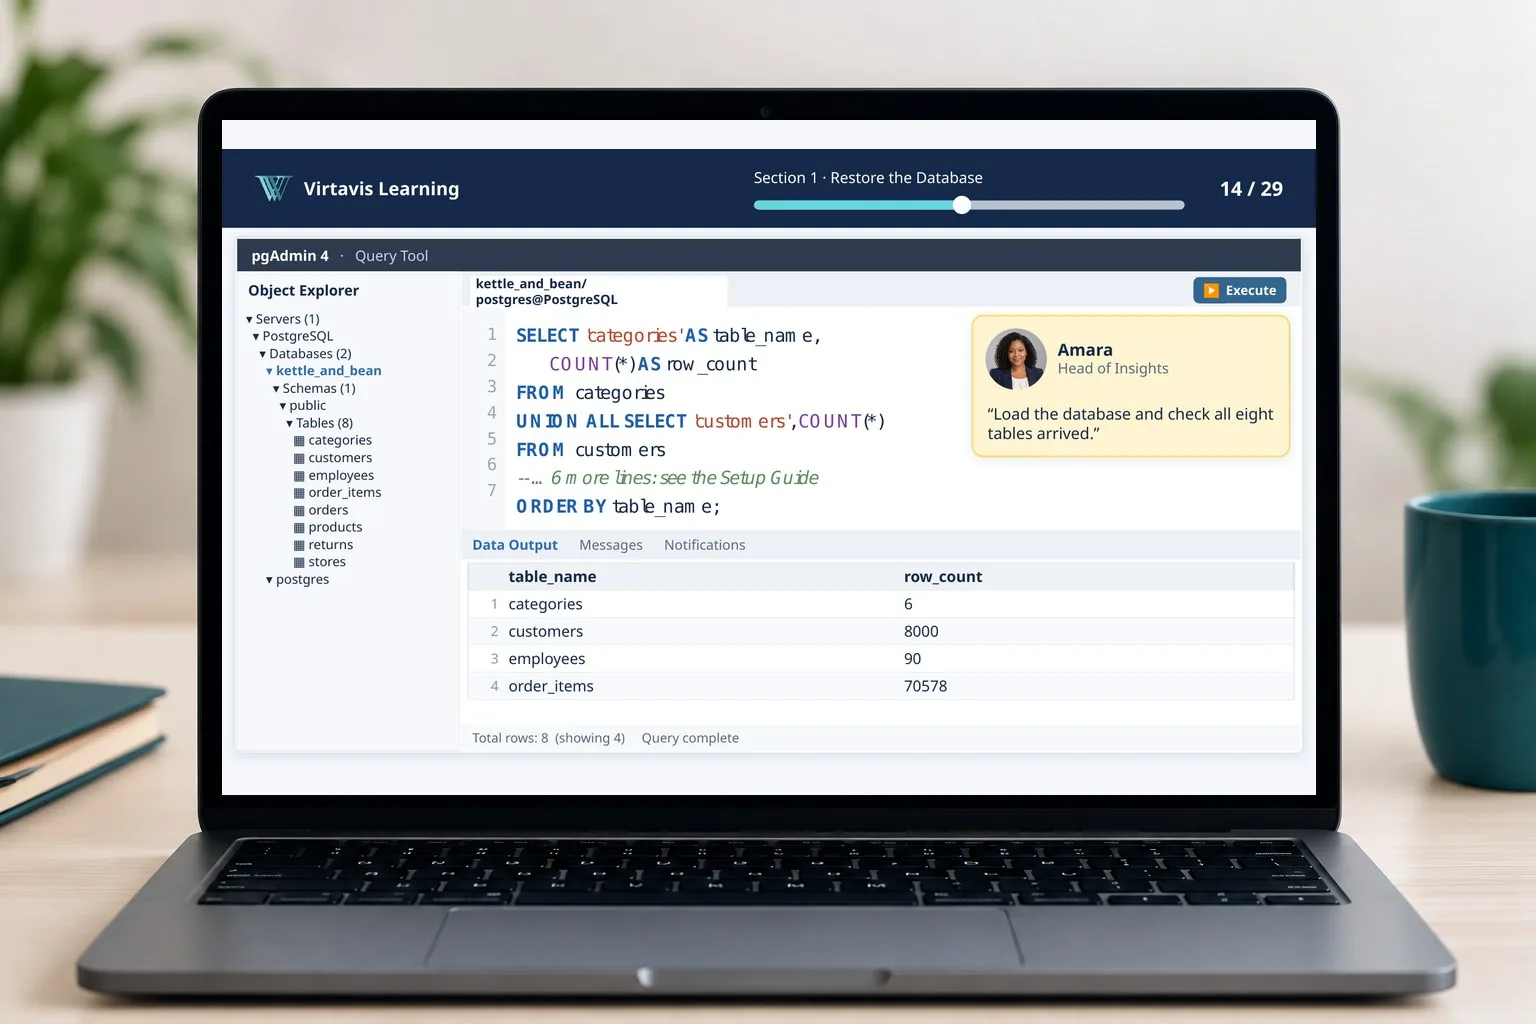
Laptop showing a Section 1 lesson: a query in pgAdmin checks that all eight Kettle & Bean tables loaded, with row counts
You will need

PostgreSQL and pgAdmin are both free. Section 1 guides you through installing and setting them up, so you can get started without preparing your environment in advance. A setup and troubleshooting guide is included. No previous SQL experience is needed.

What's included

Everything in this course

Video lessons

Live query demonstrations in pgAdmin, each starting with a request from a colleague, followed by three "Try these" tasks.

Course handbook

A written companion to every section, so you can review the queries and ideas at your own pace.

Quizzes

Short checks at the end of each section to confirm you have understood the key ideas.

Challenges and solution walkthroughs

Challenge briefings to work through on your own, then a solution walkthrough to compare your query with.

The Kettle & Bean database

Sales, customer and returns data from the fictional company, ready to load into PostgreSQL.

Setup and troubleshooting guide

Step-by-step help installing PostgreSQL and pgAdmin, plus fixes for common setup problems.
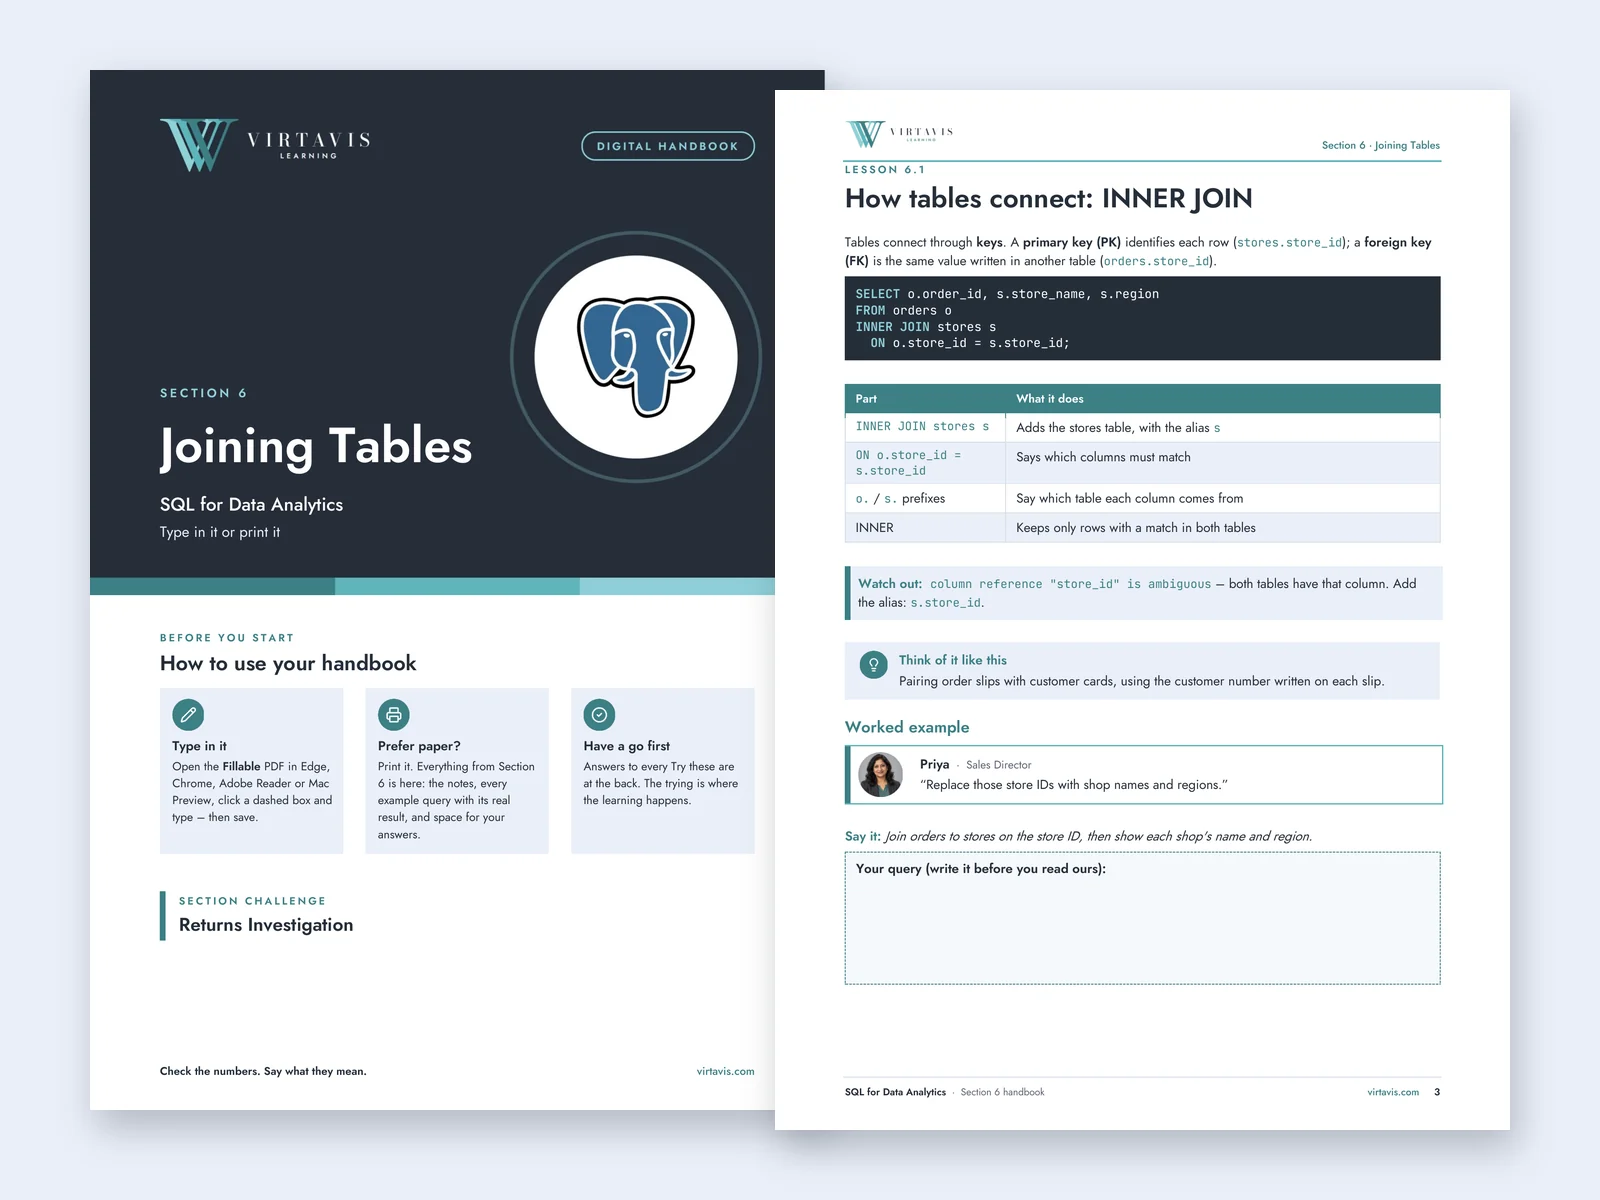
Two pages of the SQL course handbook: the Section 6 Joining Tables cover and the Lesson 6.1 page on INNER JOIN with a worked example

Inside the handbook

A handbook for every section

Each section has its own handbook with the notes, analogies, every example query with its real result, and space for your answers. Type in the fillable PDF or print it.

Shown: the Section 6 cover and the Lesson 6.1 page on INNER JOIN.

Course content

Nine sections, one final project

  1. 1Section 1

    Welcome to Kettle & Bean

    Set up PostgreSQL and pgAdmin, understand databases and tables, and write your first SQL queries.

  2. 2Section 2

    Readable Results with AS

    Make query results easier to understand by renaming columns and shaping output.

  3. 3Section 3

    Filter Rows with WHERE

    Filter data using conditions to find records relevant to a business question.

  4. 4Section 4

    Calculations and Rounding

    Calculate new values, work with text and dates, and round results appropriately.

  5. 5Section 5

    Summarise with Aggregate Functions

    Use aggregate functions to calculate totals, counts, averages and other business measures.

  6. 6Section 6

    How Tables Connect: INNER JOIN

    Connect related tables to combine information and answer questions across a database.

  7. 7Section 7

    Questions Inside Questions: Subqueries

    Use subqueries to answer more complex questions and analyse results from multiple steps.

  8. 8Section 8

    Rank Within Groups

    Use window functions to rank results, calculate running totals and analyse changes over time.

  9. 9Section 9Final project

    Create Your Own Tables

    Create tables, import data and bring your SQL skills together in the final board-review project.

Final project: the board review

In Section 9, create tables and import data, then apply the SQL skills you've developed throughout the course to complete a board-review project for Kettle & Bean. Summarise your findings in plain English and explain what the results mean.
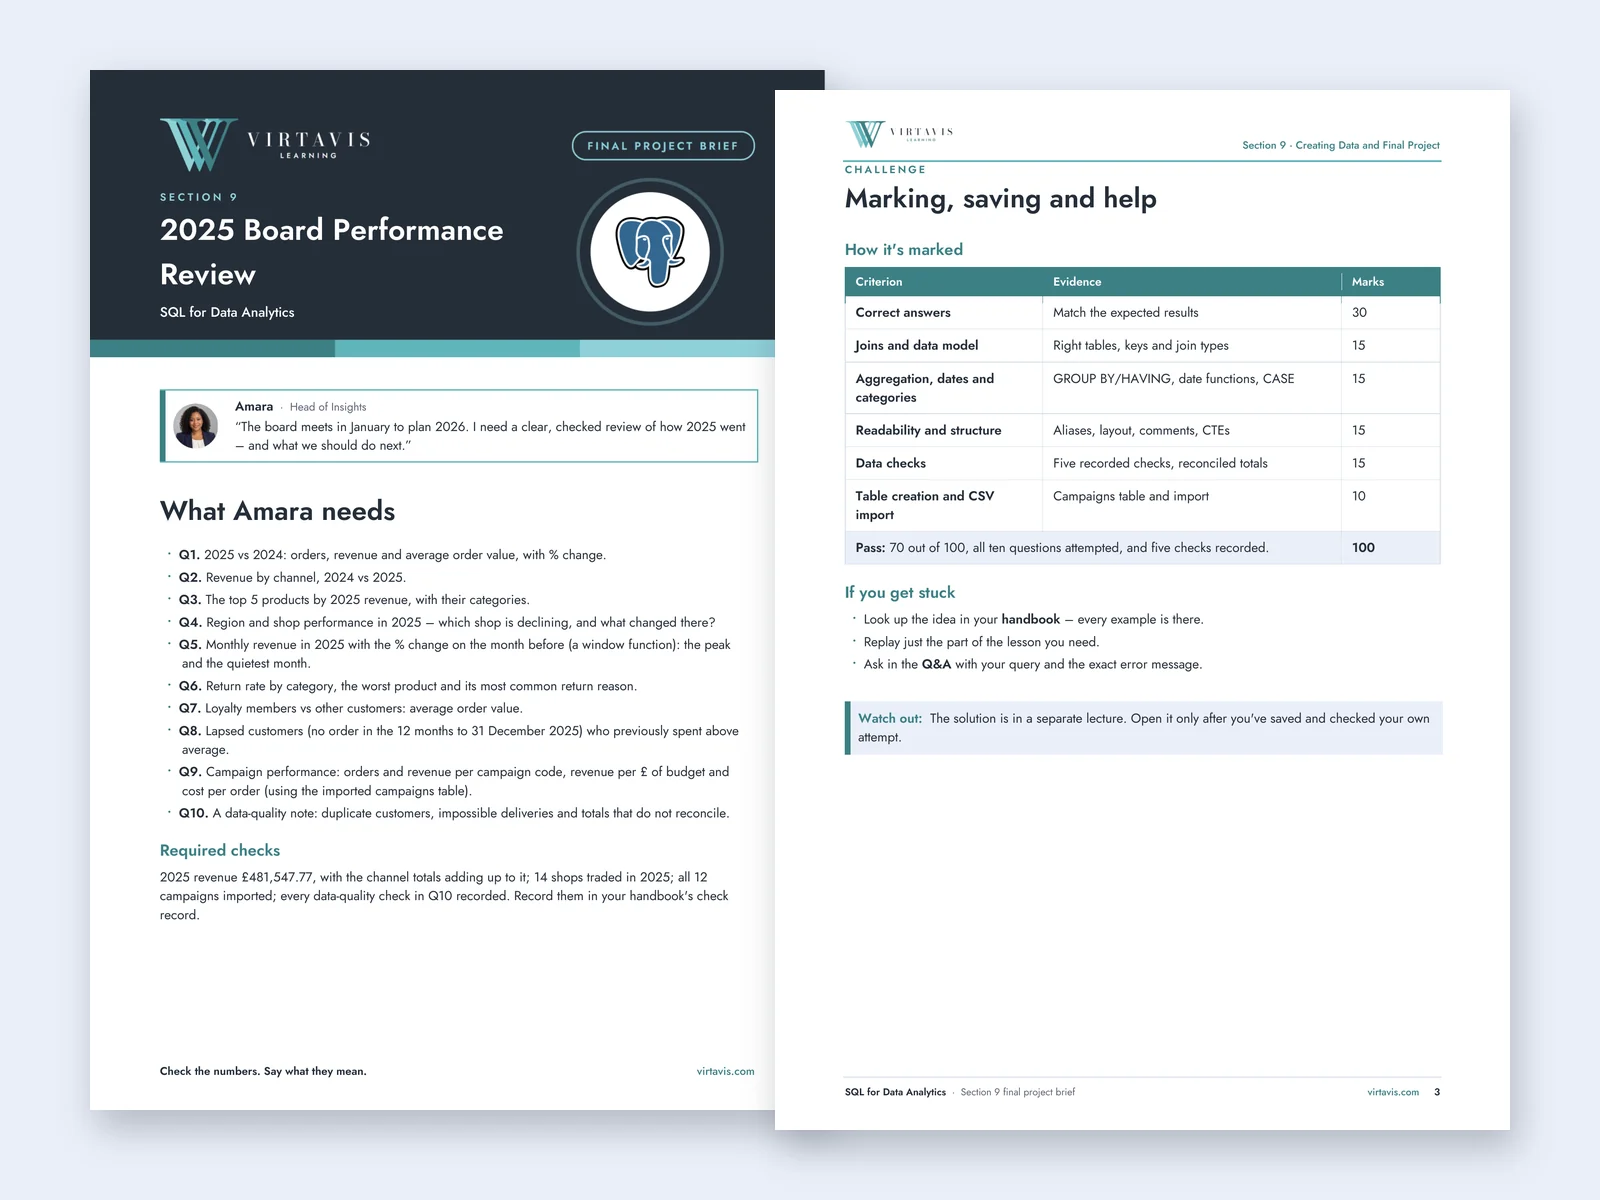
Two pages of the Section 9 final project brief: Amara's request for a 2025 board performance review with ten questions, and the marking table

See inside the course

Real queries, real results

Explore screenshots from the actual lessons, including SQL queries and their results in pgAdmin. Each example uses the course database to show how SQL works in practice. Click or tap any image to see it full size.
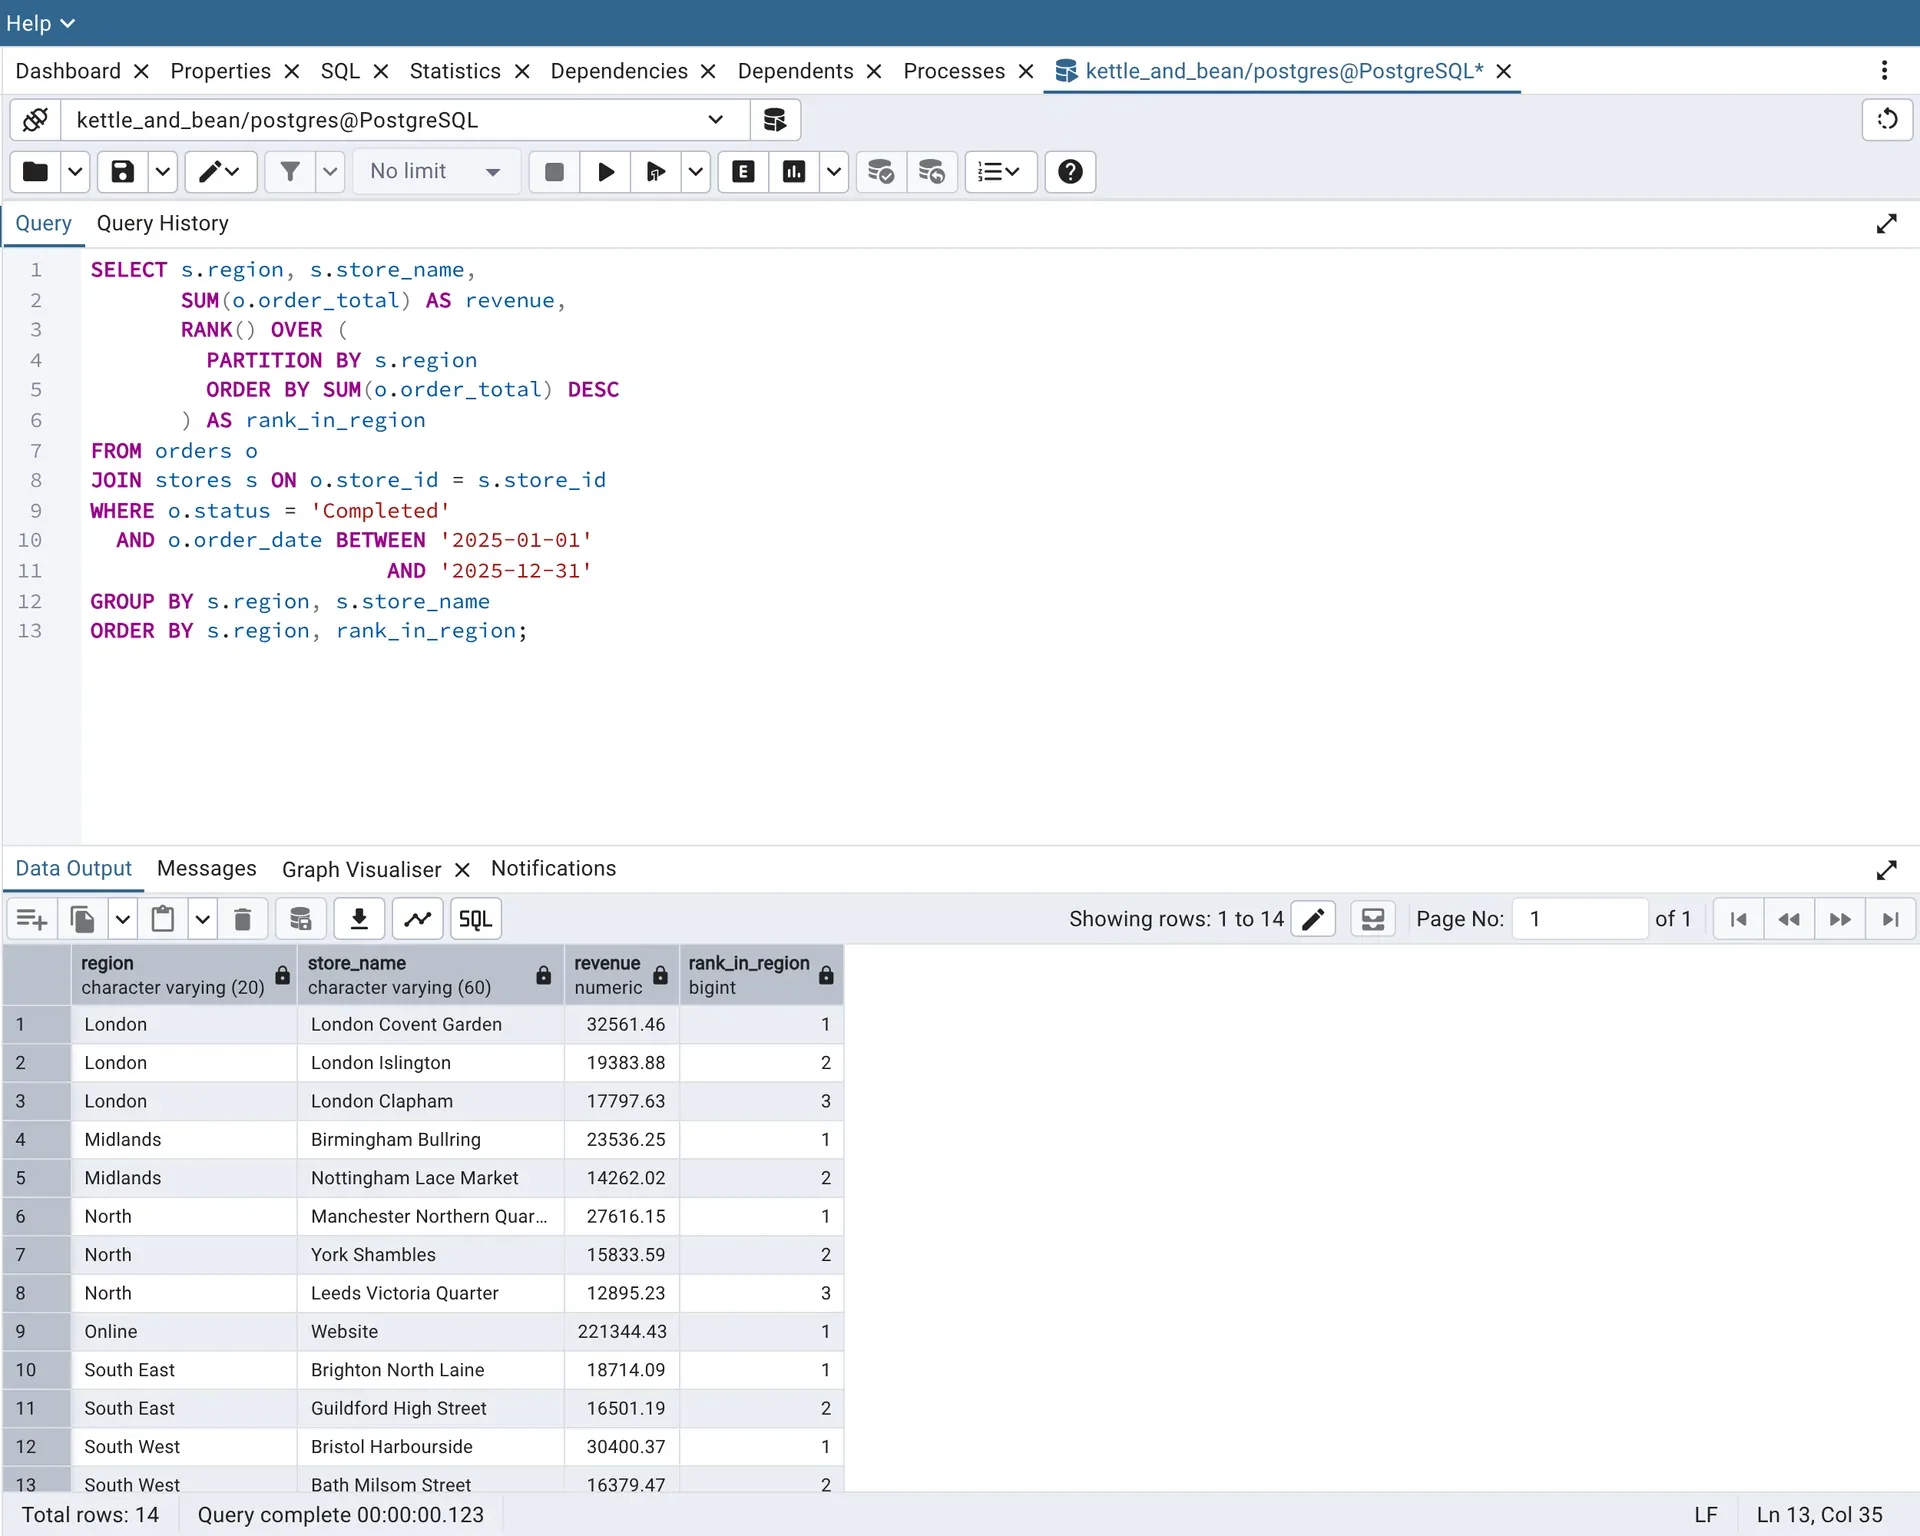
pgAdmin query using RANK() OVER to rank shops by 2025 revenue within each region, with results
Lesson 8.1: Rank each shop within its region with a window function.
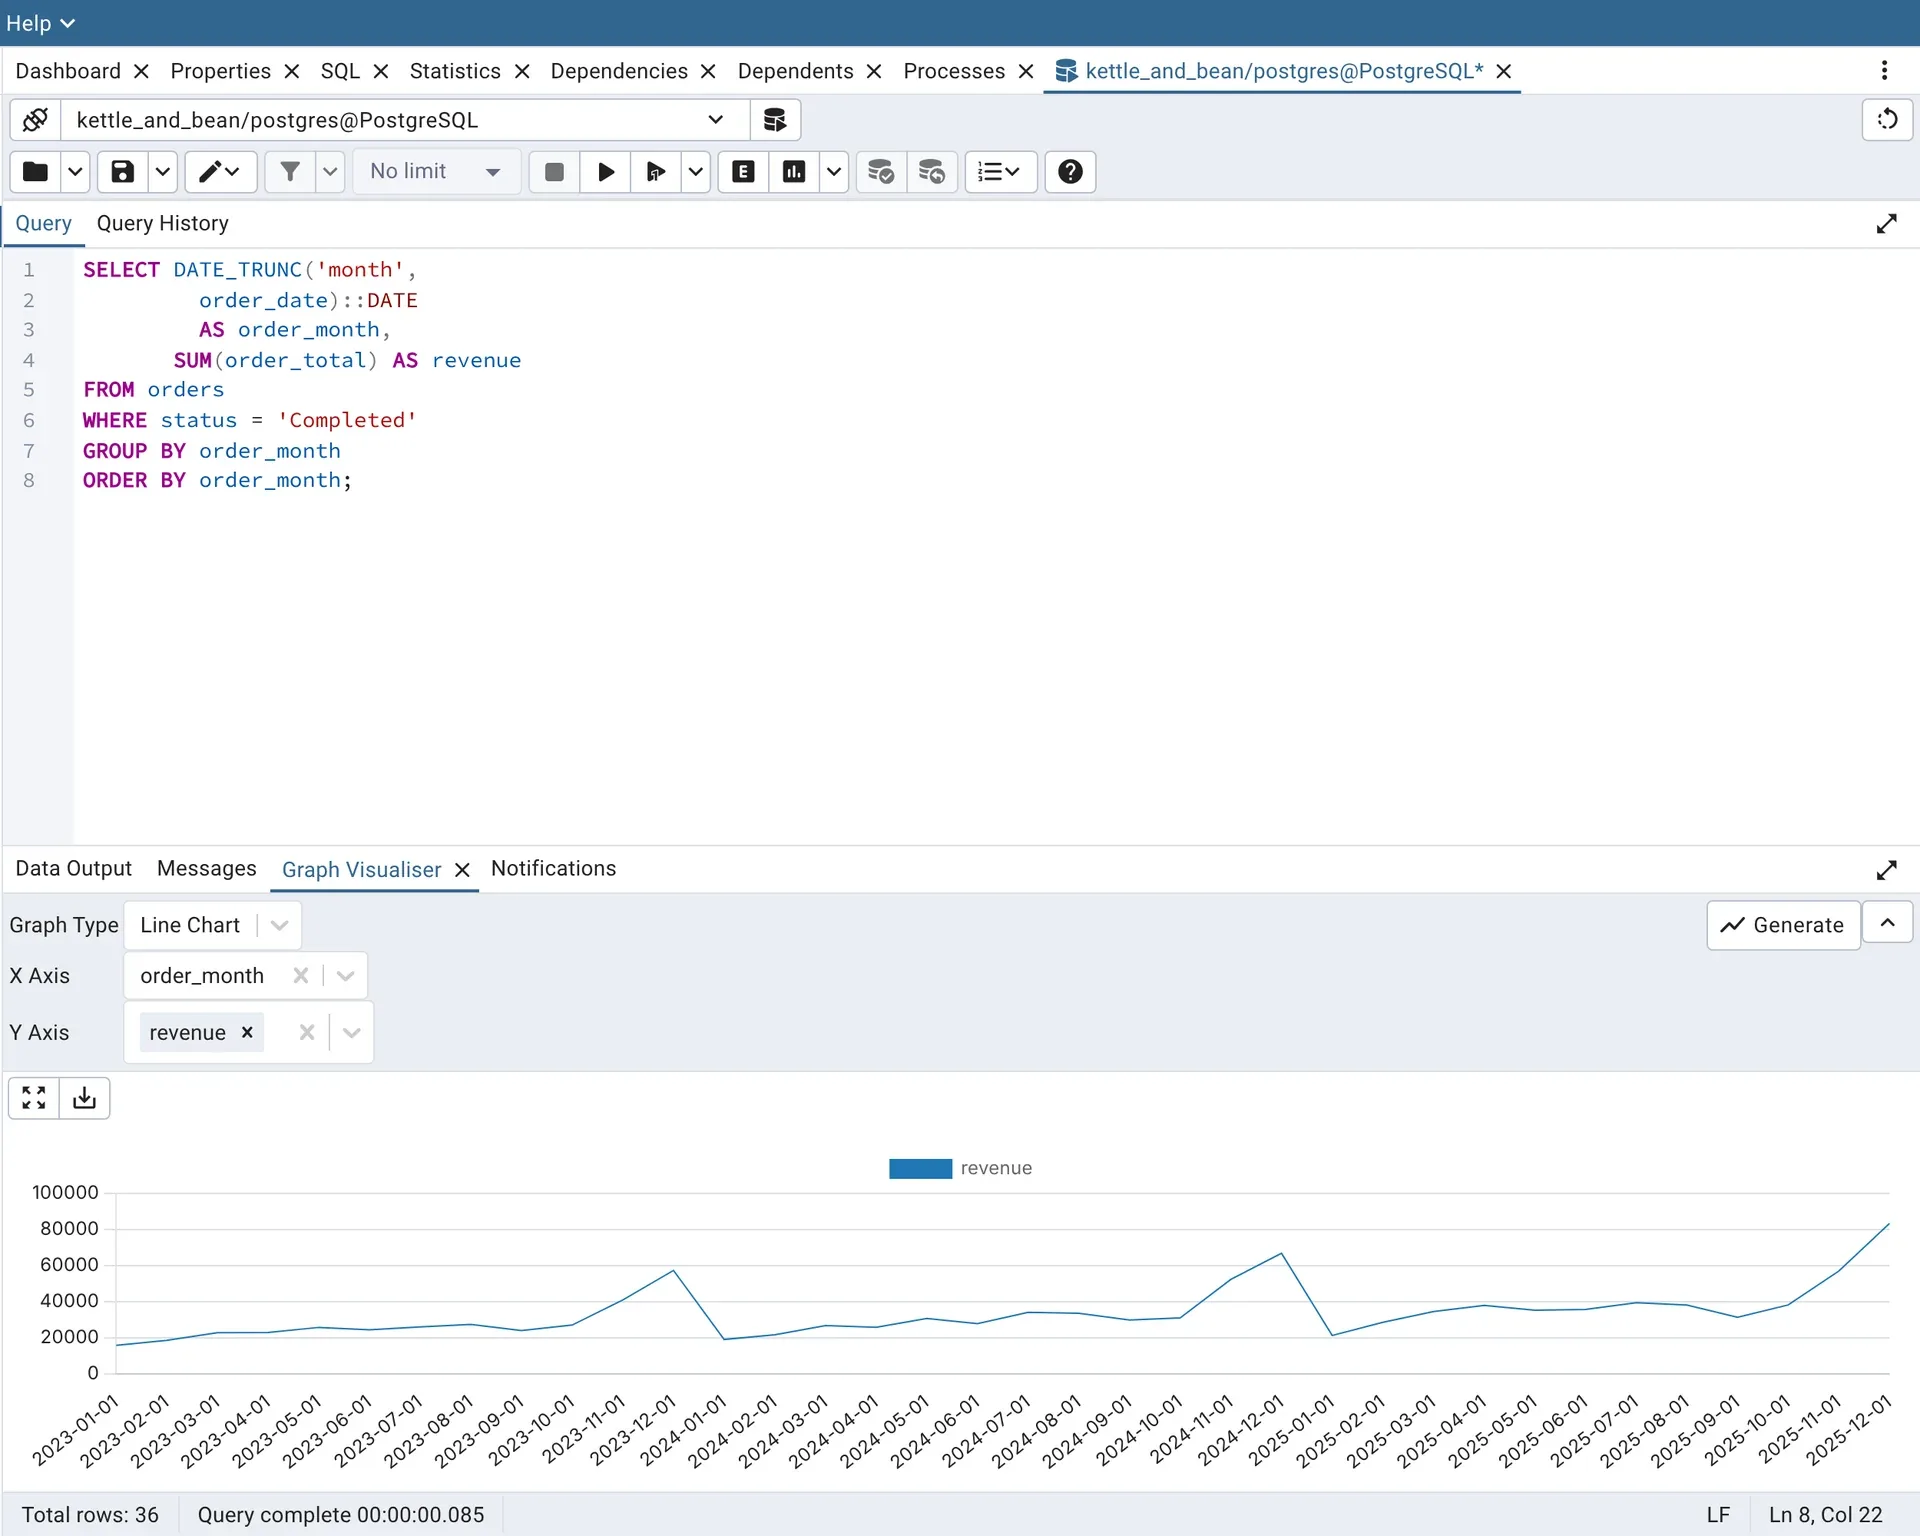
pgAdmin line chart of Kettle & Bean monthly revenue from 2023 to 2025, built from a SQL query
Lesson 5.4: Monthly revenue over three years, charted in pgAdmin.
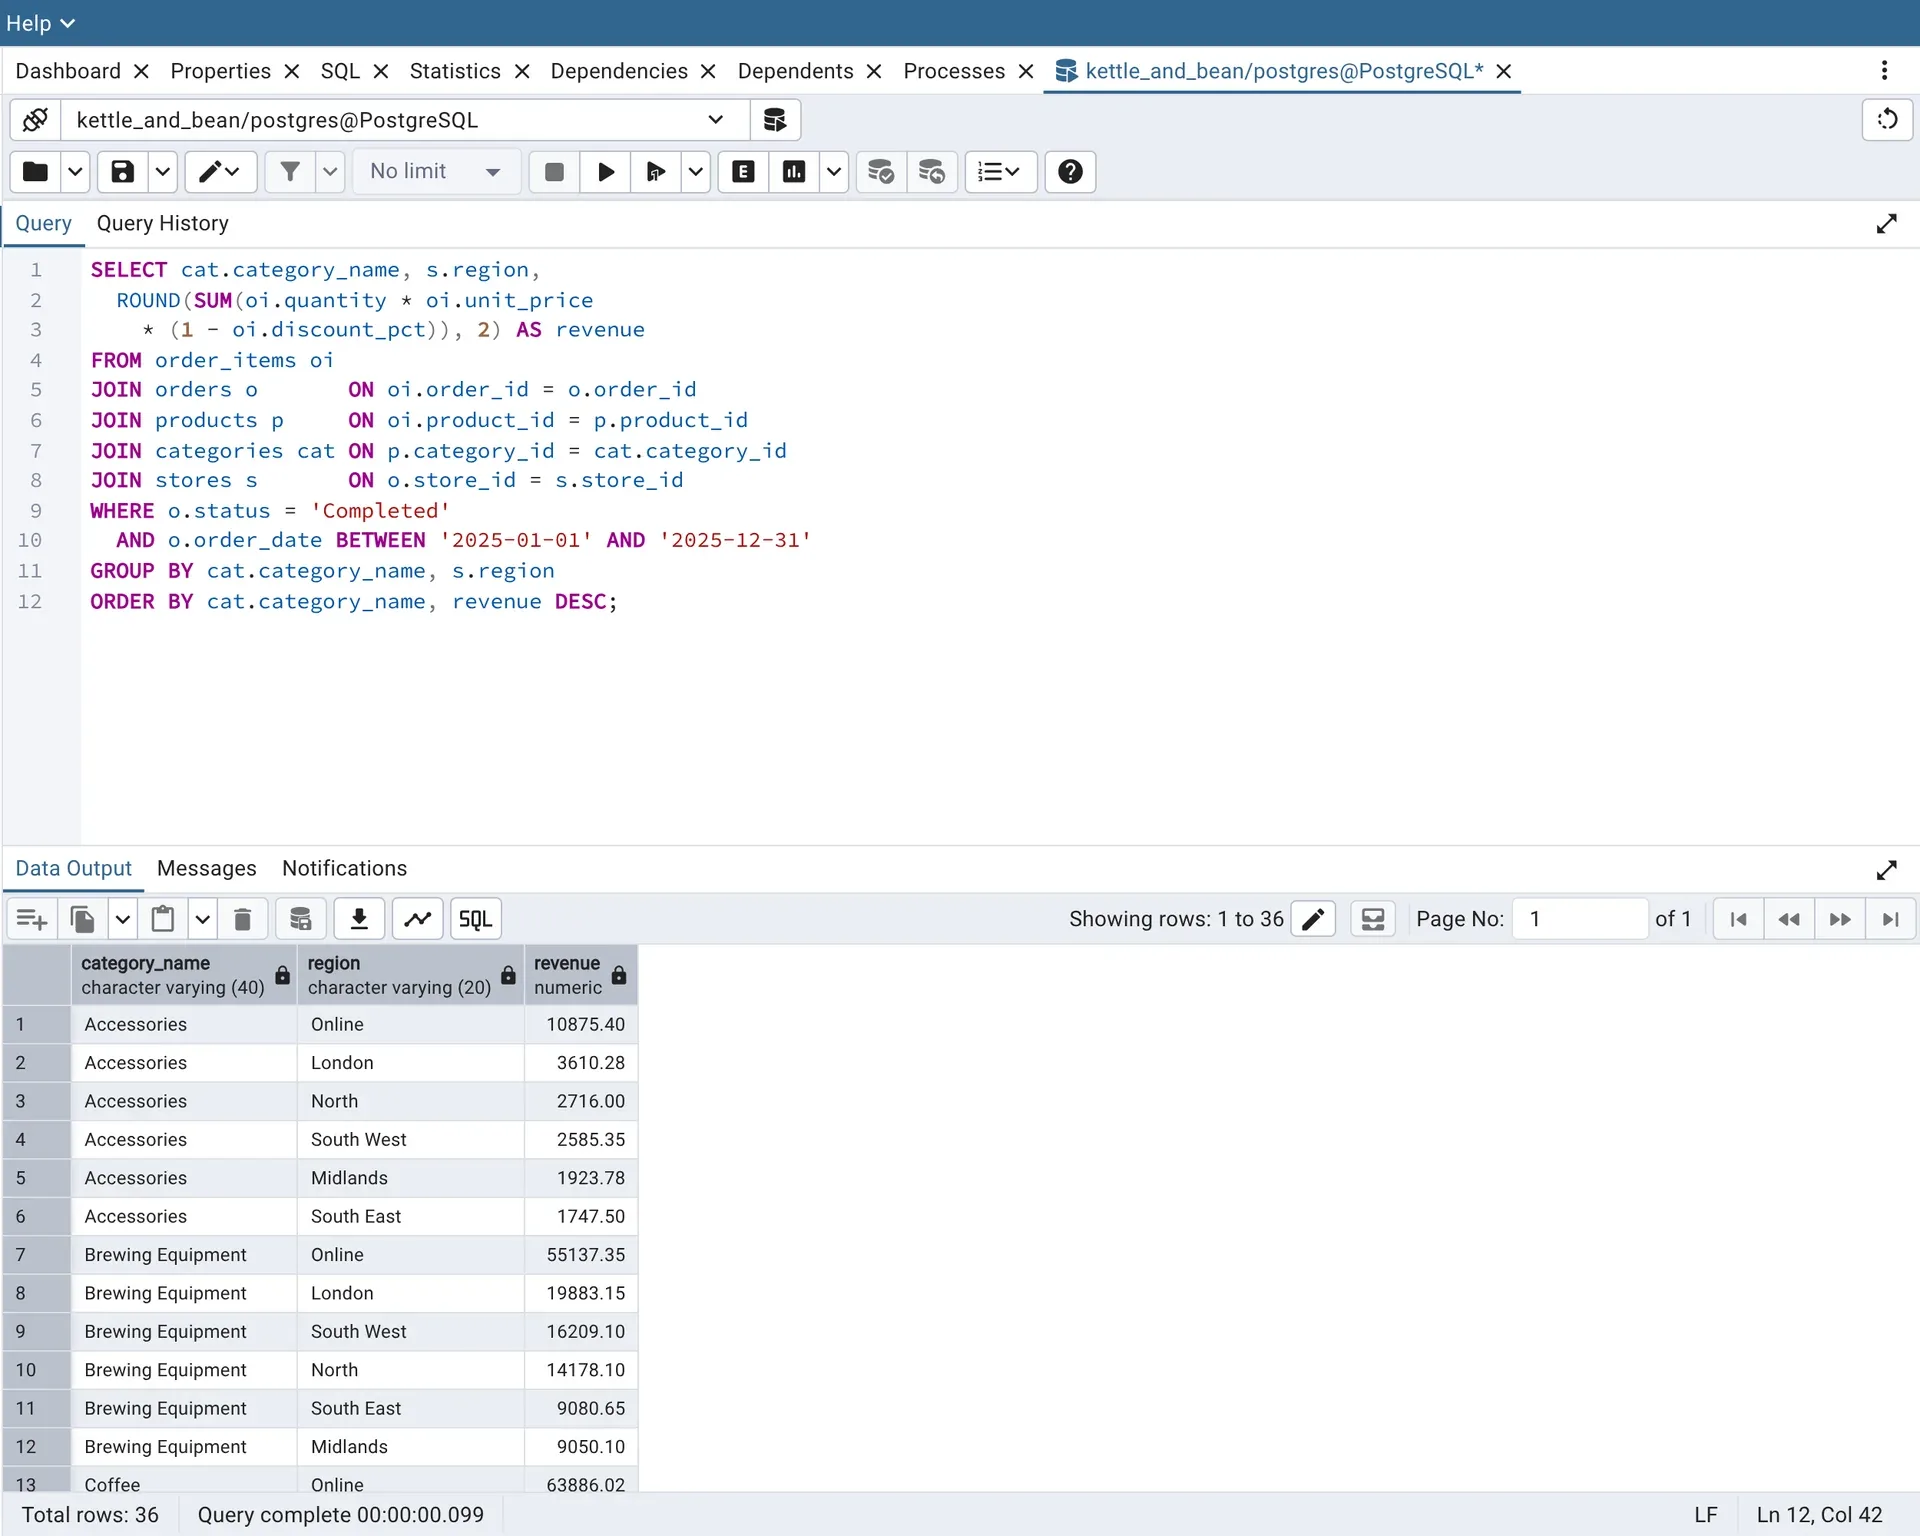
pgAdmin query joining four tables to show 2025 revenue by product category and region, with results
Lesson 6.3: Revenue by product category and region, joining four tables.

Scenes from the lesson

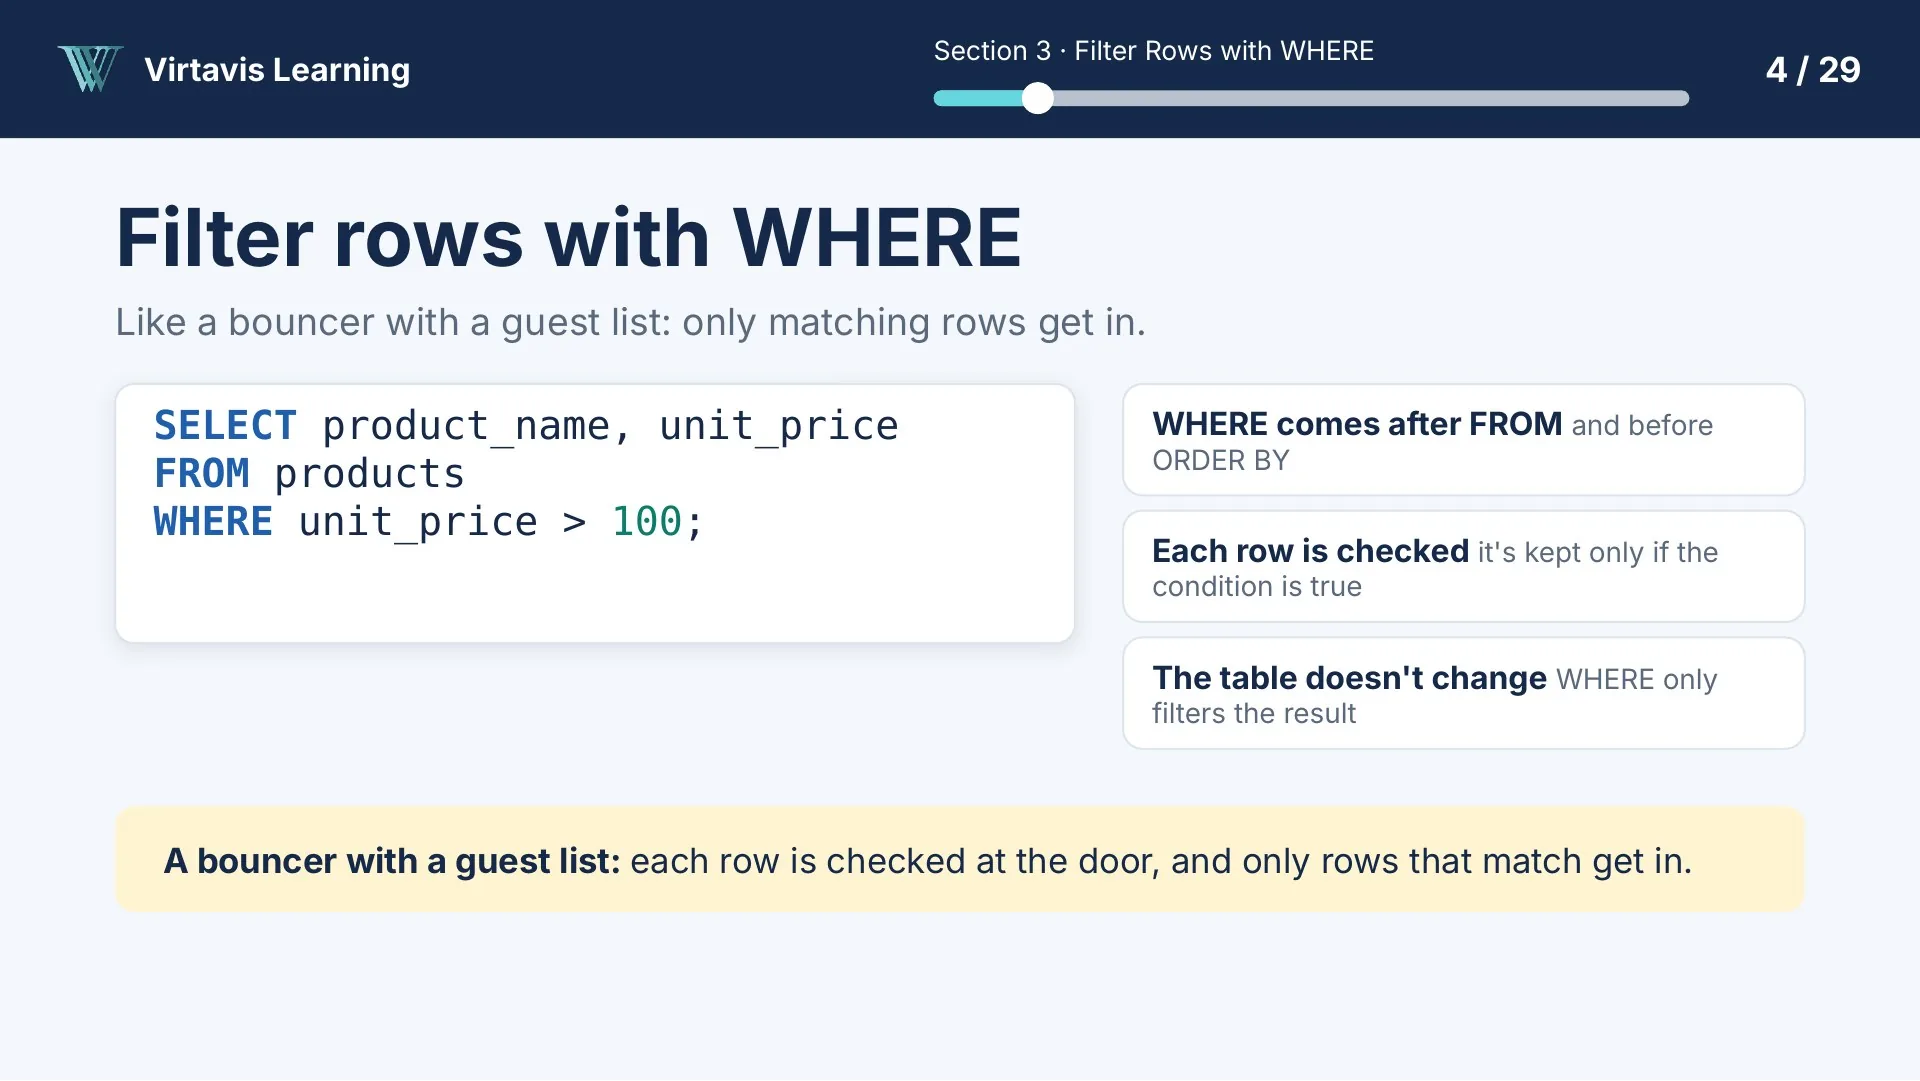
Lesson slide: Filter rows with WHERE, explained as a bouncer with a guest list
Section 3: Filter rows with WHERE.
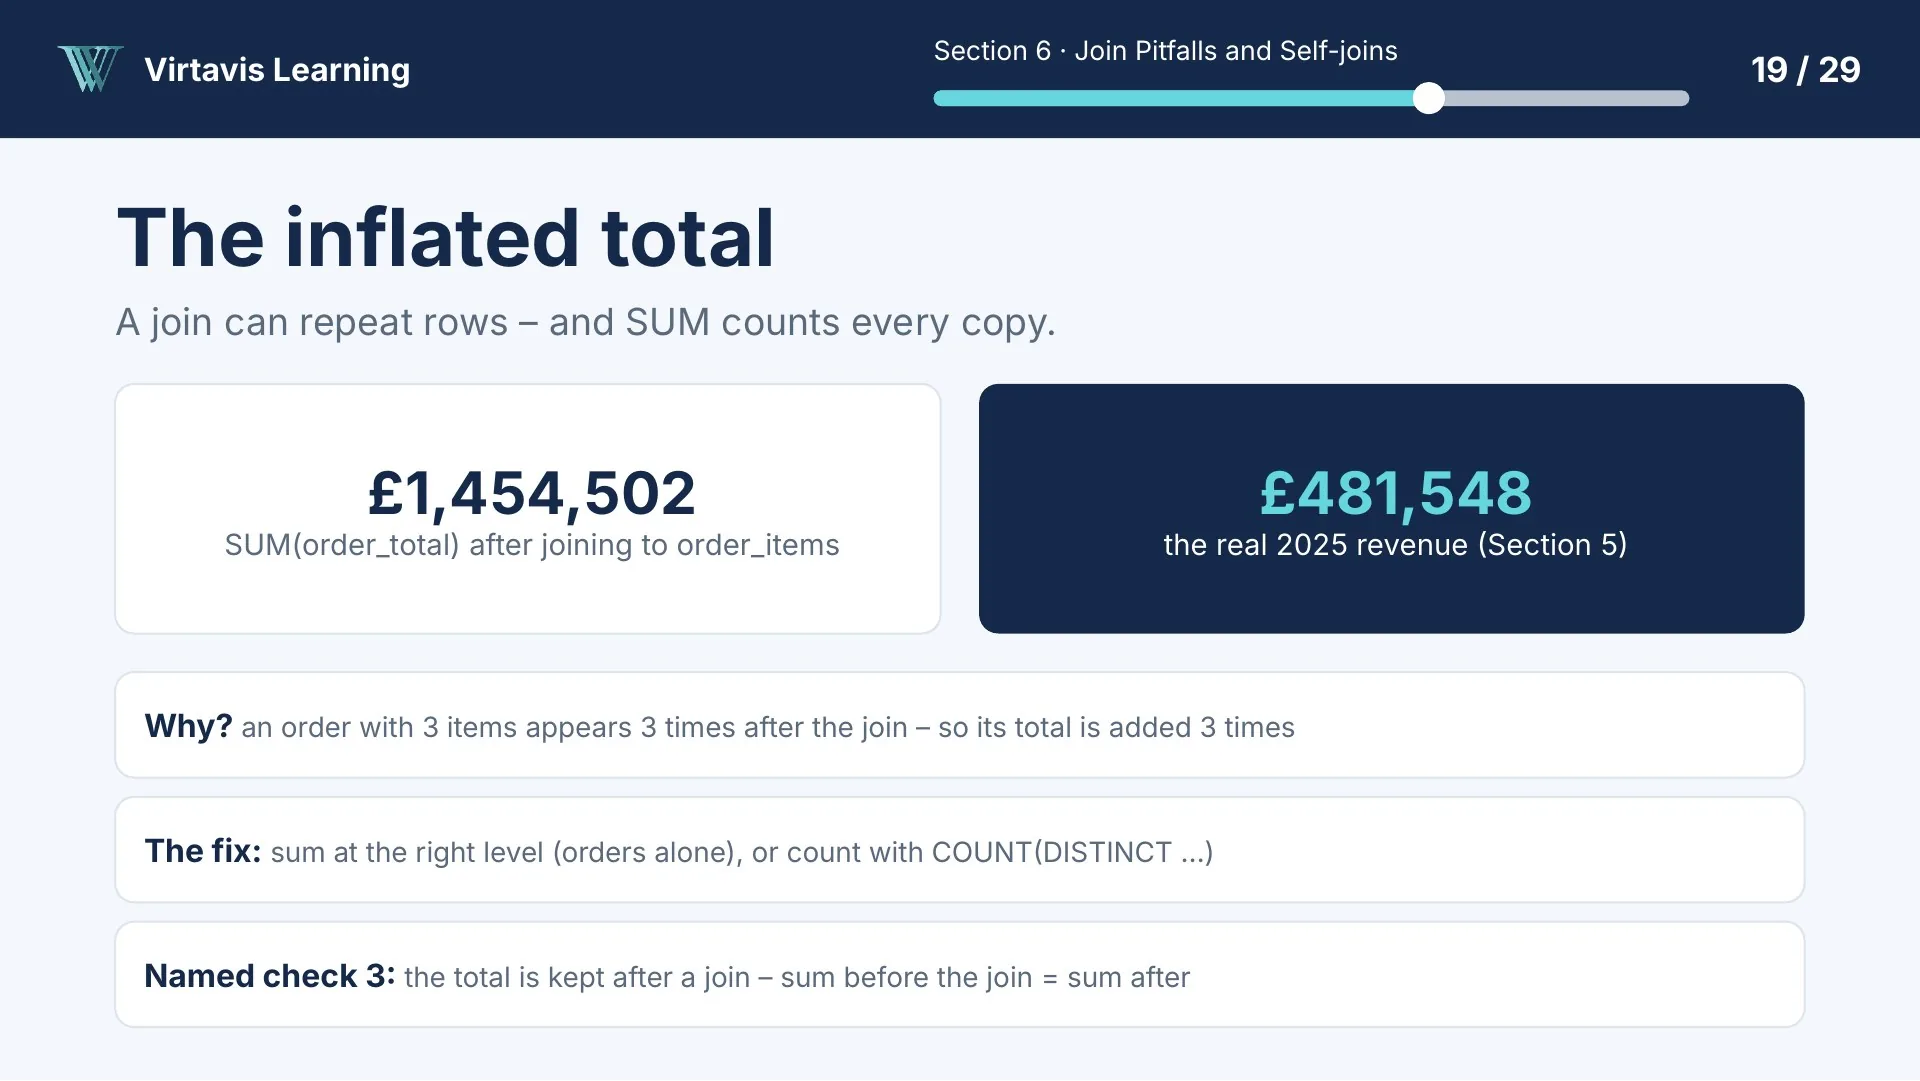
Lesson slide: The inflated total, showing how a join can count revenue more than once
Section 6: The inflated total, and how to check a join.
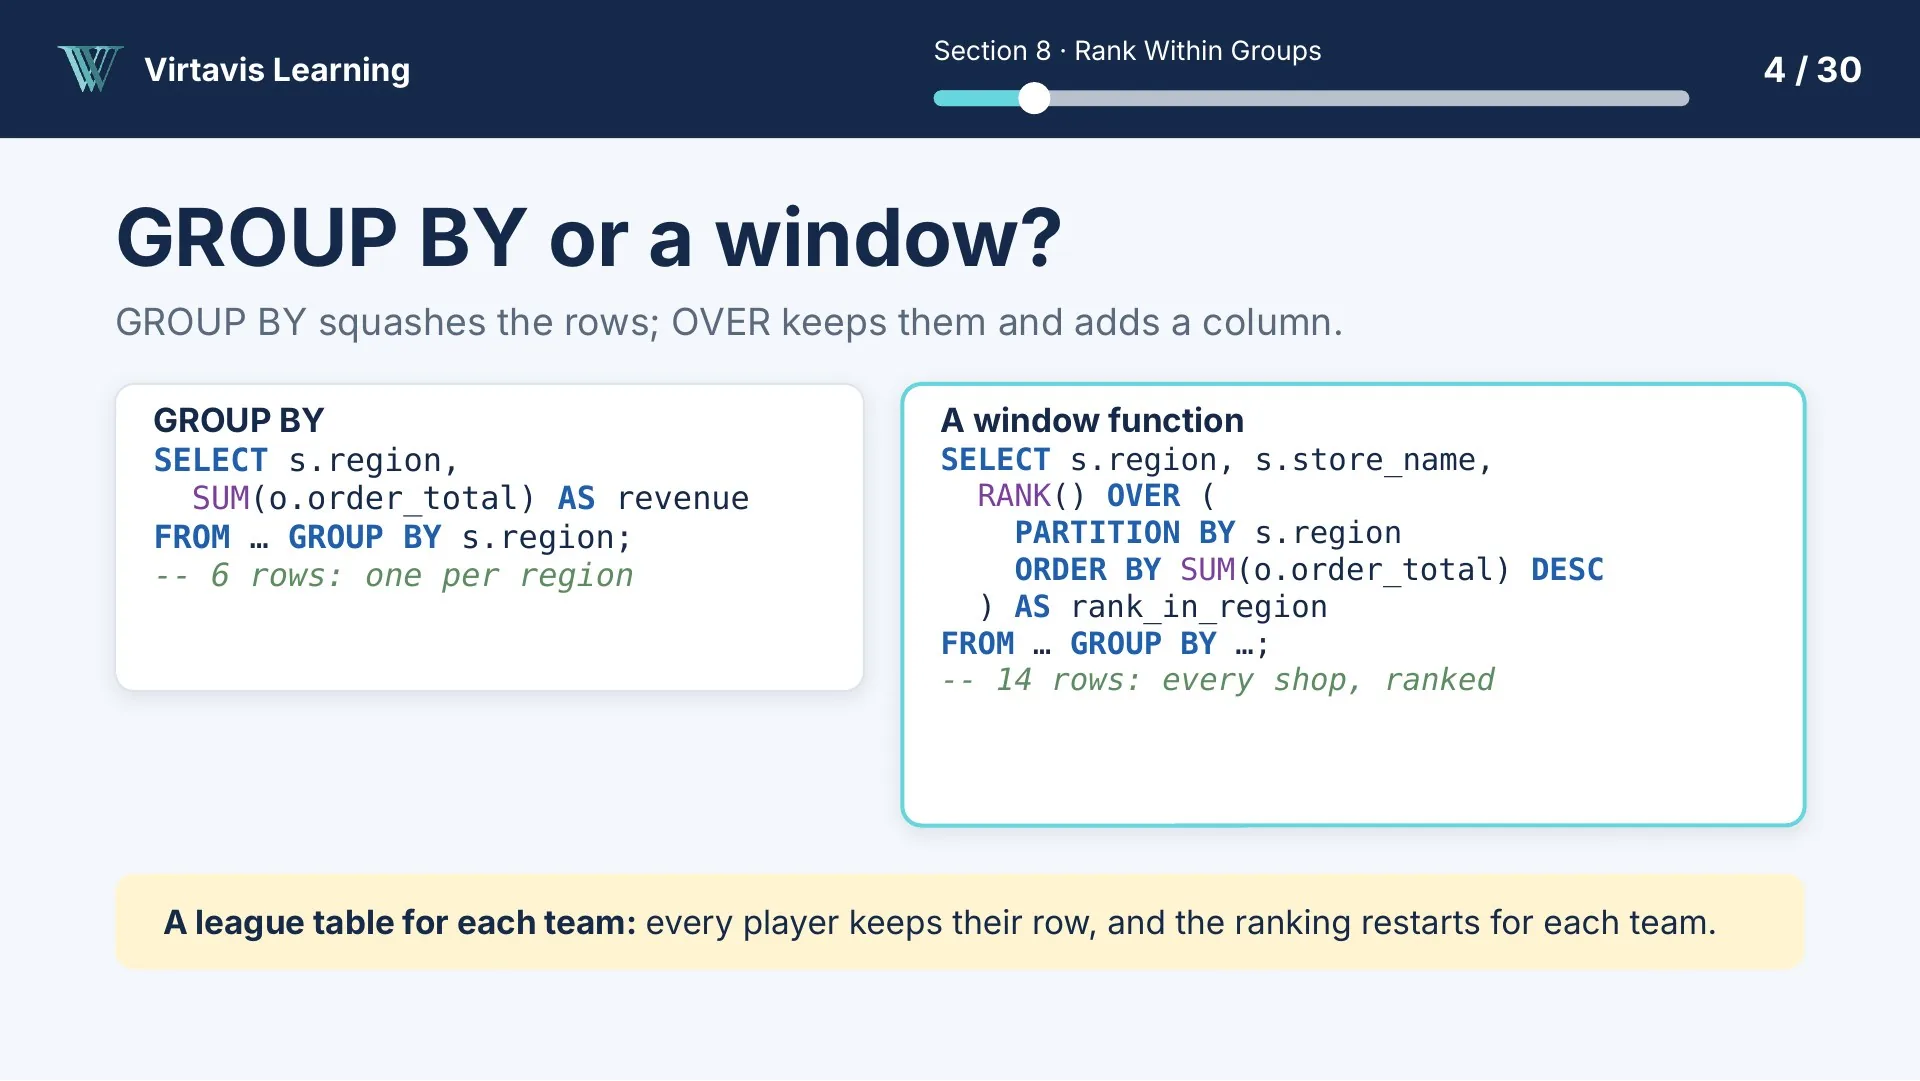
Lesson slide comparing GROUP BY with a window function
Section 8: GROUP BY or a window function?

Kettle & Bean Co. is a fictional company created for teaching.
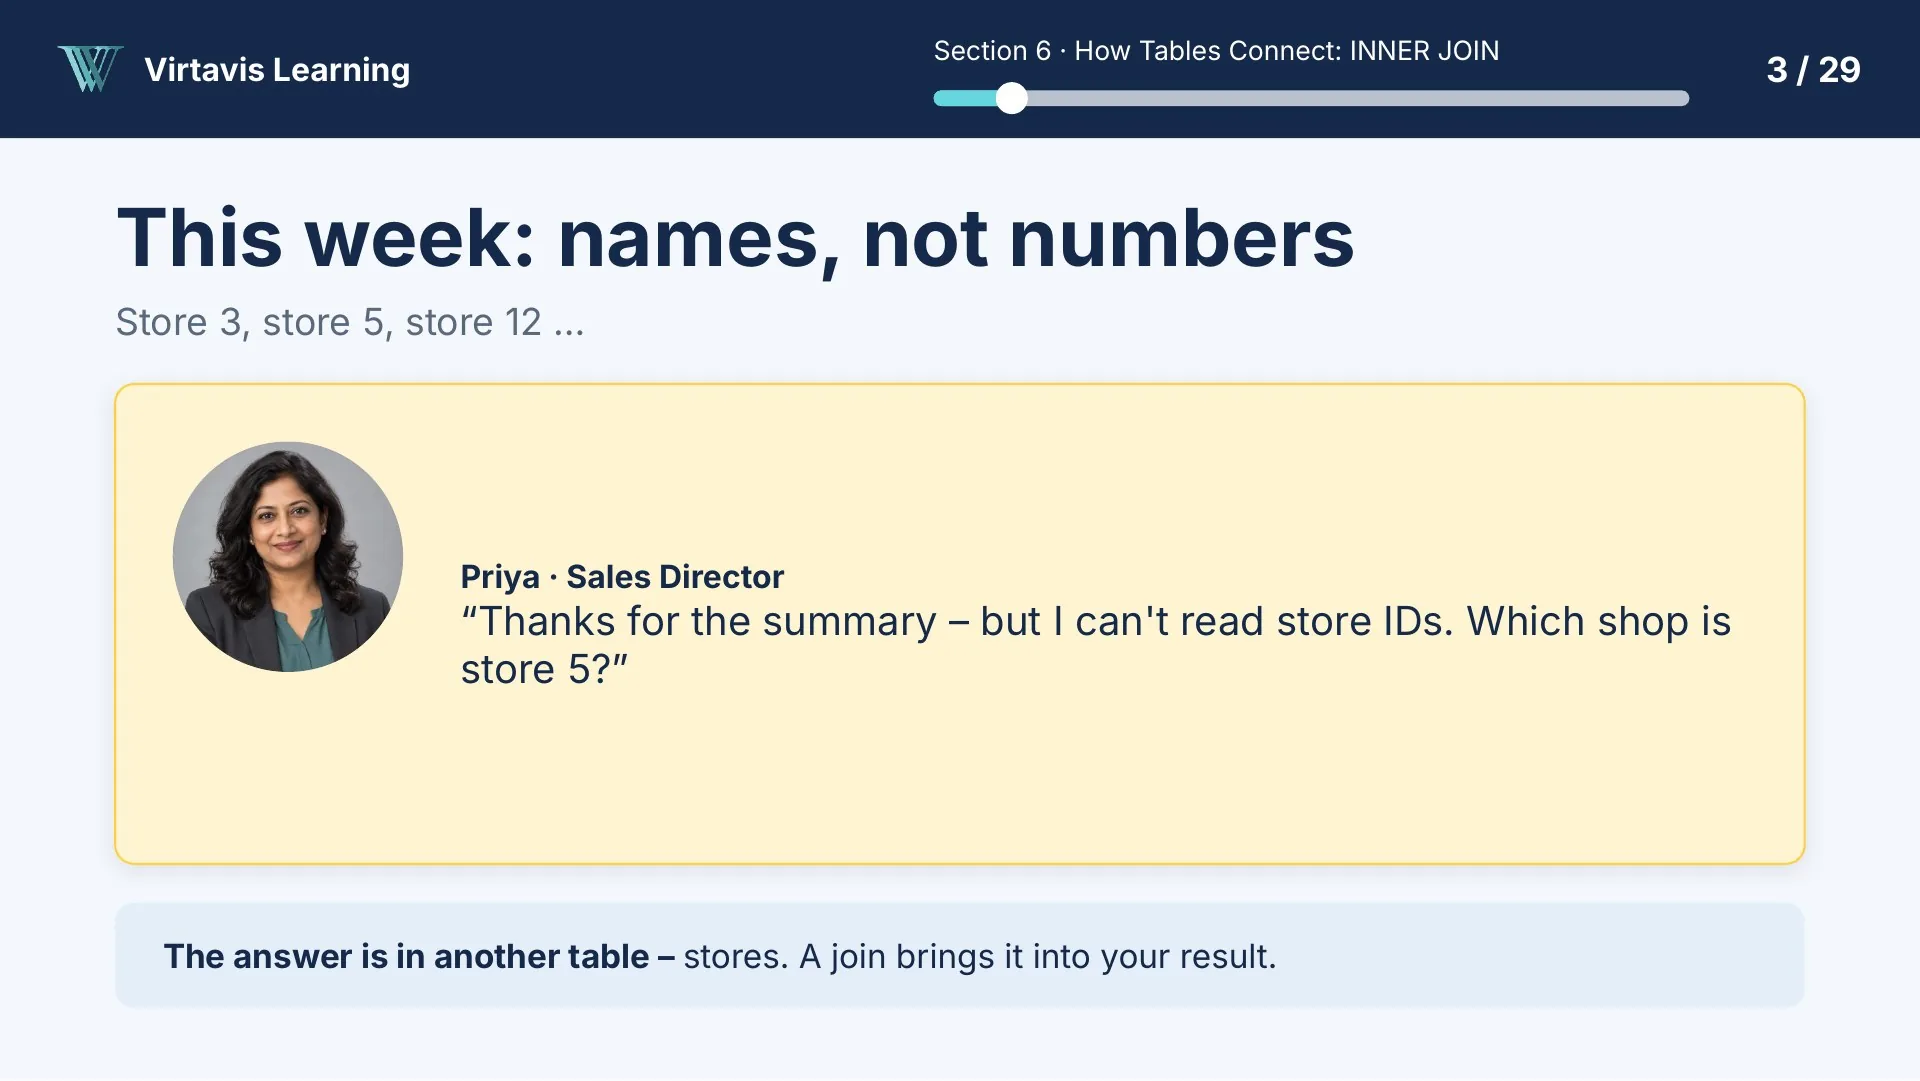
Lesson slide from Section 6: Priya, Sales Director, says she can't read store IDs and asks which shop is store 5

The learning scenario

Answer questions from the Kettle & Bean team

Each lesson starts with a realistic request from a colleague at a fictional UK coffee and tea retailer. You query the data, check the result and explain what it shows.

  • Amara
    Head of Insights
  • Priya
    Sales
  • Grace
    Finance
  • Marcus
    Operations
  • Tom
    Marketing
  • Ellie
    Customer Service
Watch the free preview ›
Sophie Lumpa

Created by Virtavis Learning

Sophie Lumpa

Data and Business Intelligence Specialist, founder of Virtavis Learning

Sophie Lumpa created this course and designed the Kettle & Bean learning scenario, bringing realistic business questions into the learning experience. The Virtavis teaching team provides additional training and learner support through the Bootcamp and live cohorts.

  • BCS Certified Data Analyst
  • BSc (Hons) Business Management and IT
  • Adult education teaching qualification
  • AgilePM
  • Certified Scrum Master

Questions

Questions about the course?

Something else?

If your question isn't answered here, send it to us and the Virtavis team will reply by email.

Contact us ›
Which database software does the course use?
The course uses PostgreSQL, with pgAdmin to write and run queries. Many of the SQL concepts you learn are used in other database systems too, although syntax and features can vary.
What software do I need?
PostgreSQL and pgAdmin, which are both free. Section 1 shows you how to set them up, and the setup and troubleshooting guide helps if anything goes wrong.
Where do I buy this course?
On Udemy. The "View on Udemy" button opens the course page, where you can see the current price and terms.
Is it included in the Bootcamp?
Yes. The Virtavis Bootcamp brings all six courses together with the full practice dataset, additional templates and learning resources, and email support. A tutor-supported option is also available with four 30-minute one-to-one sessions, subject to the published package terms.
Do I need any SQL or Excel experience?
No. The course starts from the basics of SQL. It helps to be comfortable working with tables of data, for example in a spreadsheet.
Do I get a certificate?
Udemy provides its certificate of completion, subject to its terms. As part of our commitment to delivering high-quality professional learning, we are working towards obtaining CPD accreditation for our courses. We look forward to sharing further updates as we progress.

Start with the free preview.

See how the lessons work before you choose.

View on Udemy ›Explore the Bootcamp