

Video lessons
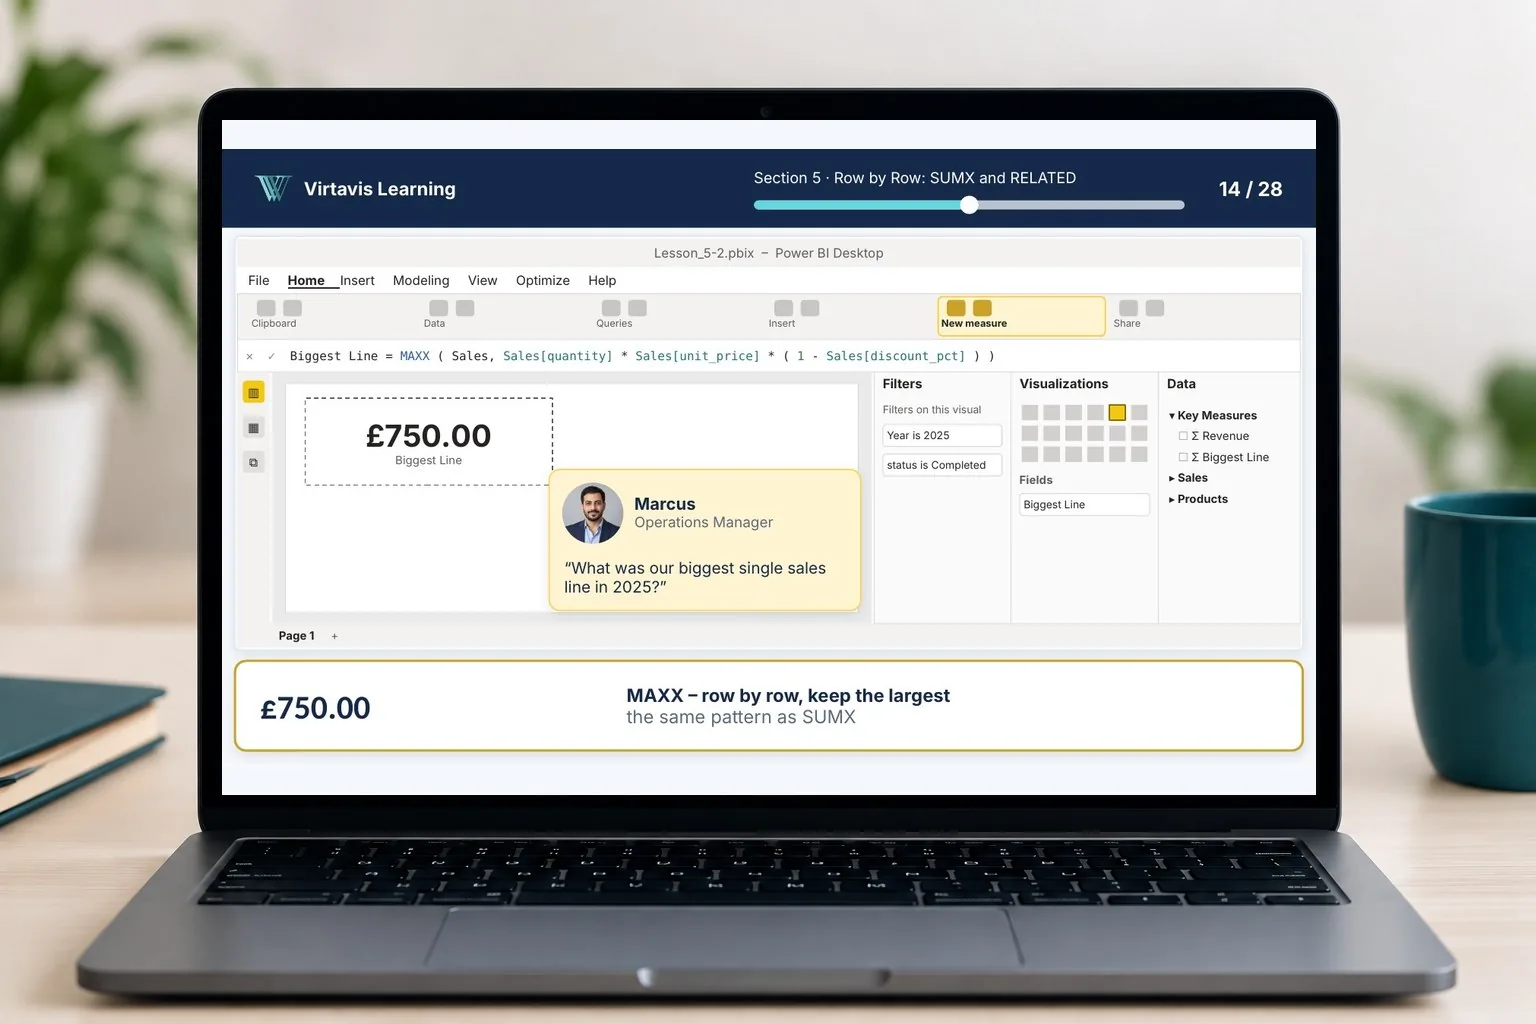
Each question broken into its parts, then the DAX or visual built live, with every part of the code explained.
Course 4 of 6 · The Data Analytics pathway
Power Query, DAX & Dashboards
Turn business questions into DAX measures and visuals, and then into decisions. Clean data with Power Query, build a data model and design a dashboard people actually use, answering requests from the fictional Kettle & Bean team.
Free preview lesson
What you will learn
Who it is for
A Windows PC. Power BI Desktop is free but runs on Windows only, so Mac users need a Windows PC or a Windows virtual machine. No paid licence is needed. No Power BI, DAX or Excel experience is needed.
What's included
Each question broken into its parts, then the DAX or visual built live, with every part of the code explained.
A handbook for every section, so you can review the ideas and examples at your own pace.
Short checks at the end of each section to confirm you have understood the key ideas.
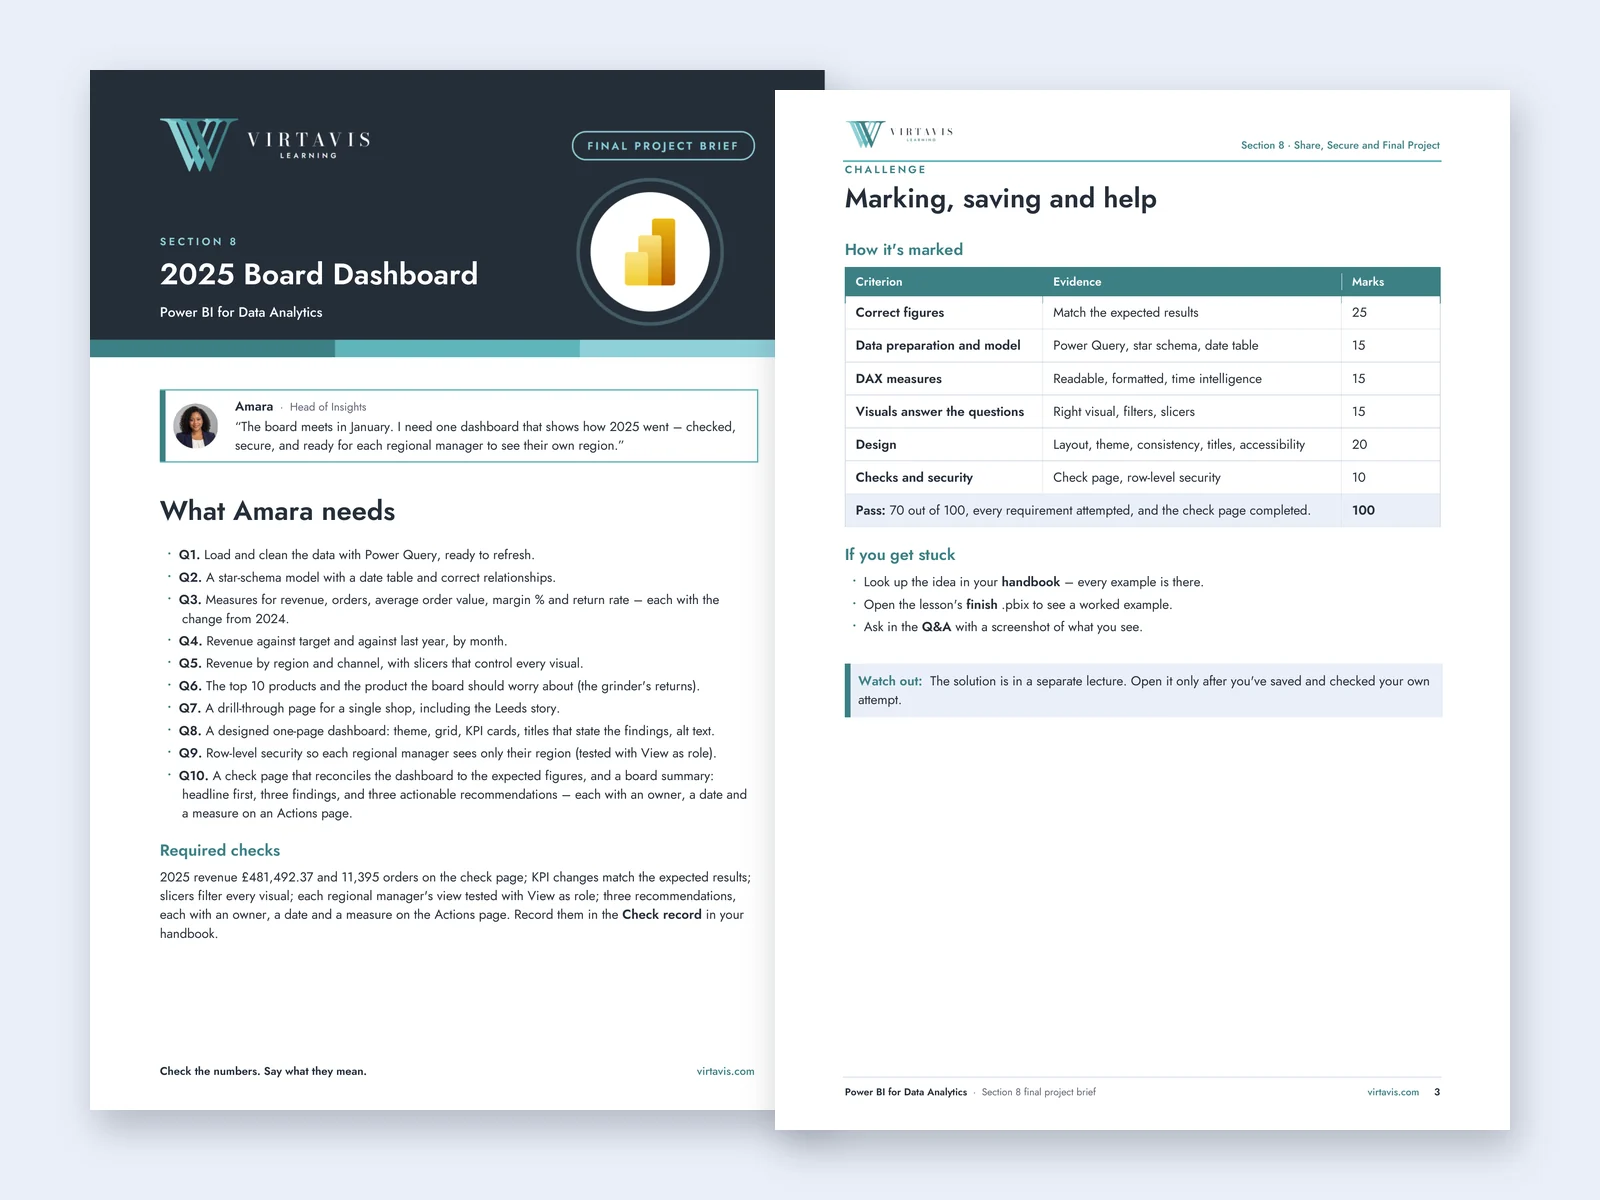
A challenge brief to work through on your own in each section, then a solution walkthrough to compare your work with.
Three years of sales, customer, returns and target data from the fictional company, with start files for each lesson.
A decomposition tree, key influencers, a forecast and Q&A, with each answer confirmed by a measure.
Inside the handbook
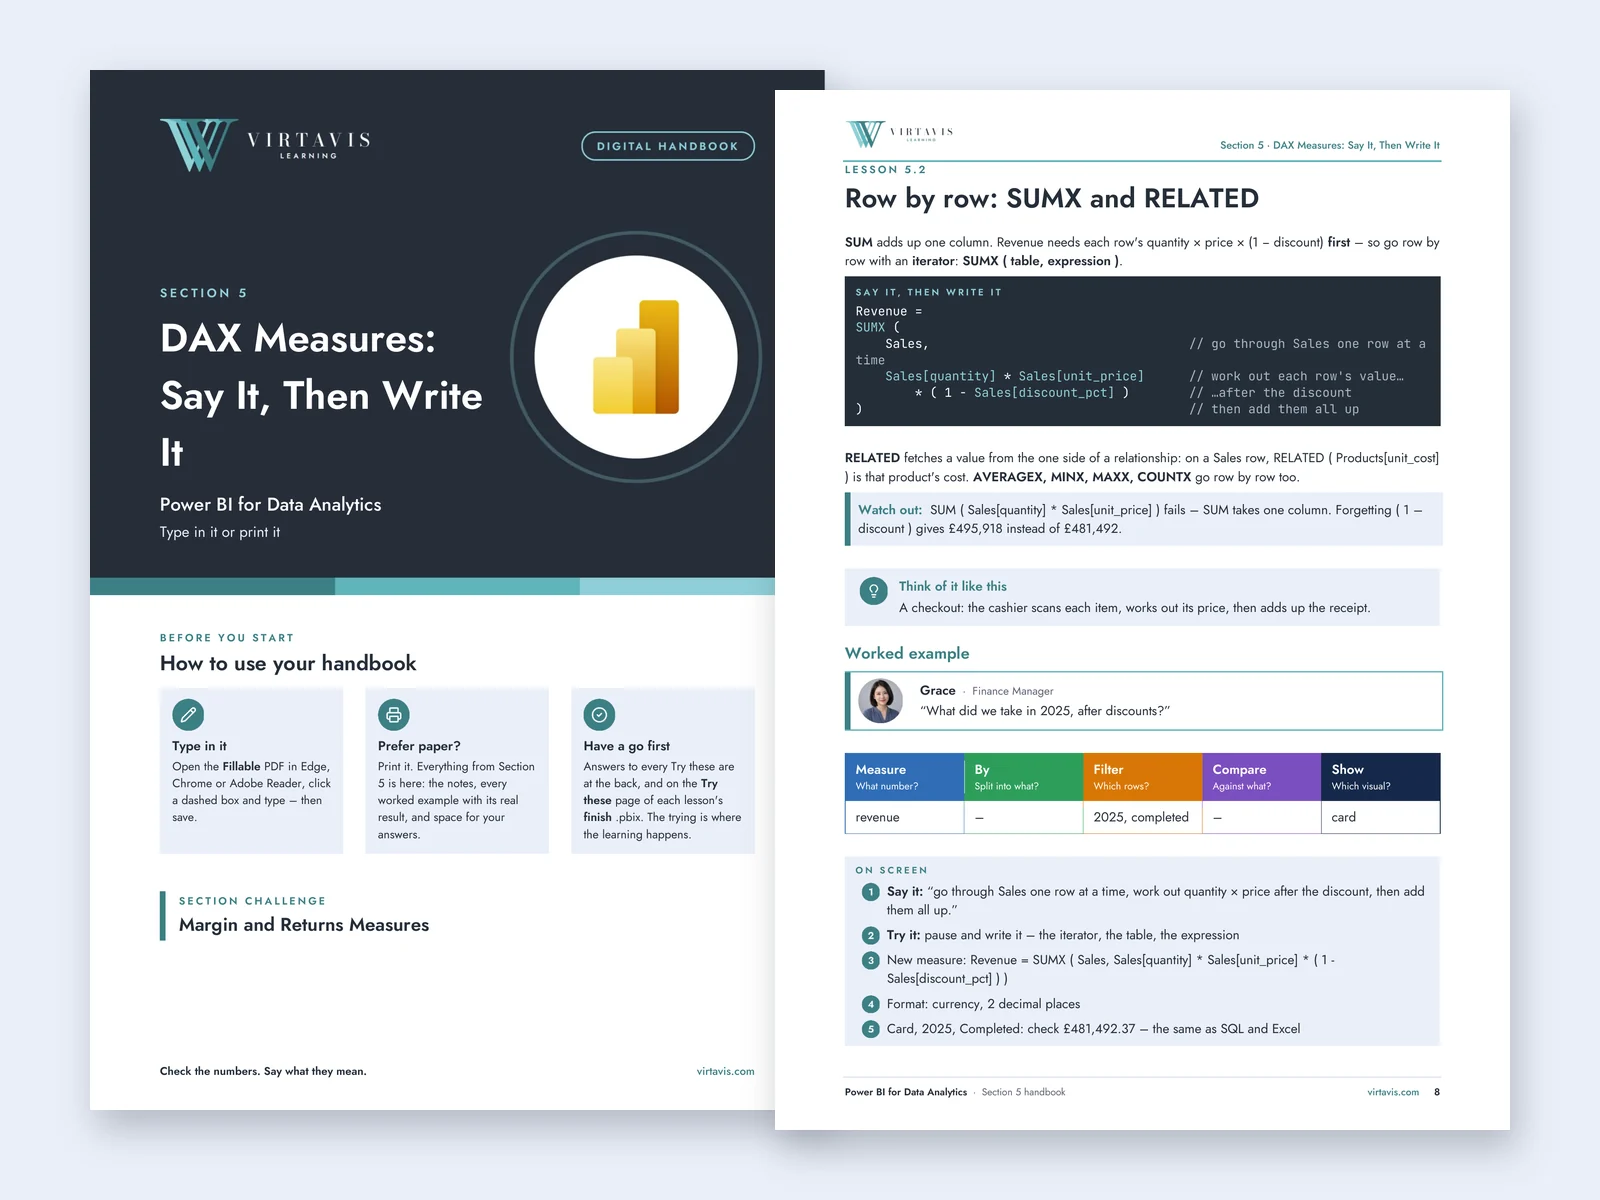
Each section has its own handbook with the notes, analogies, every worked example with its real result, and space for your answers. Type in the fillable PDF or print it.
Shown: the Section 5 cover and the Lesson 5.2 page on SUMX and RELATED.
Course content
Load your first data, build your first visuals and learn to break down a question.
Clean and fix columns, add conditional and custom columns, and append and merge queries.
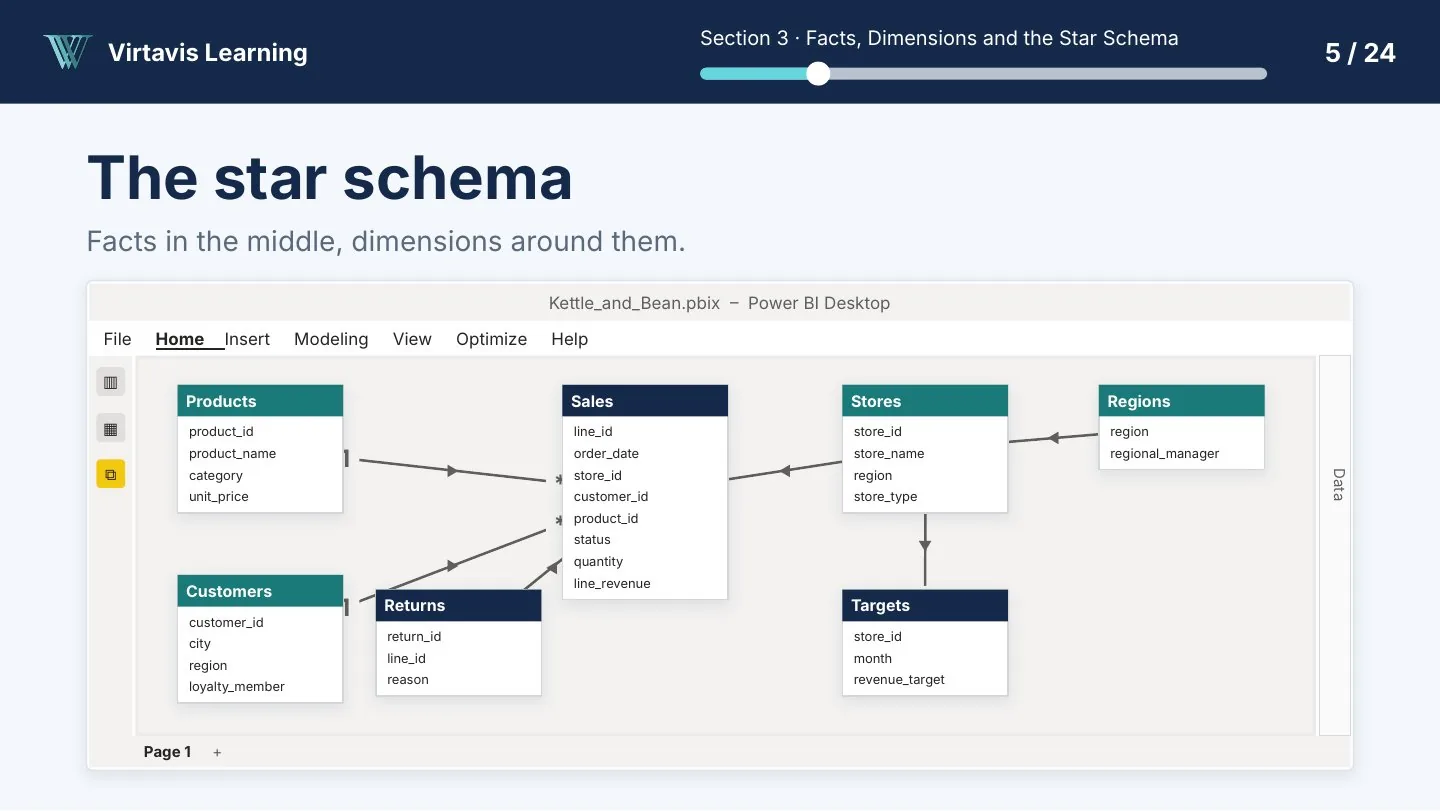
Build a star schema with facts, dimensions, relationships, a date table and hierarchies.
Choose the visual from the question, place each field, filter and give it a clear title.
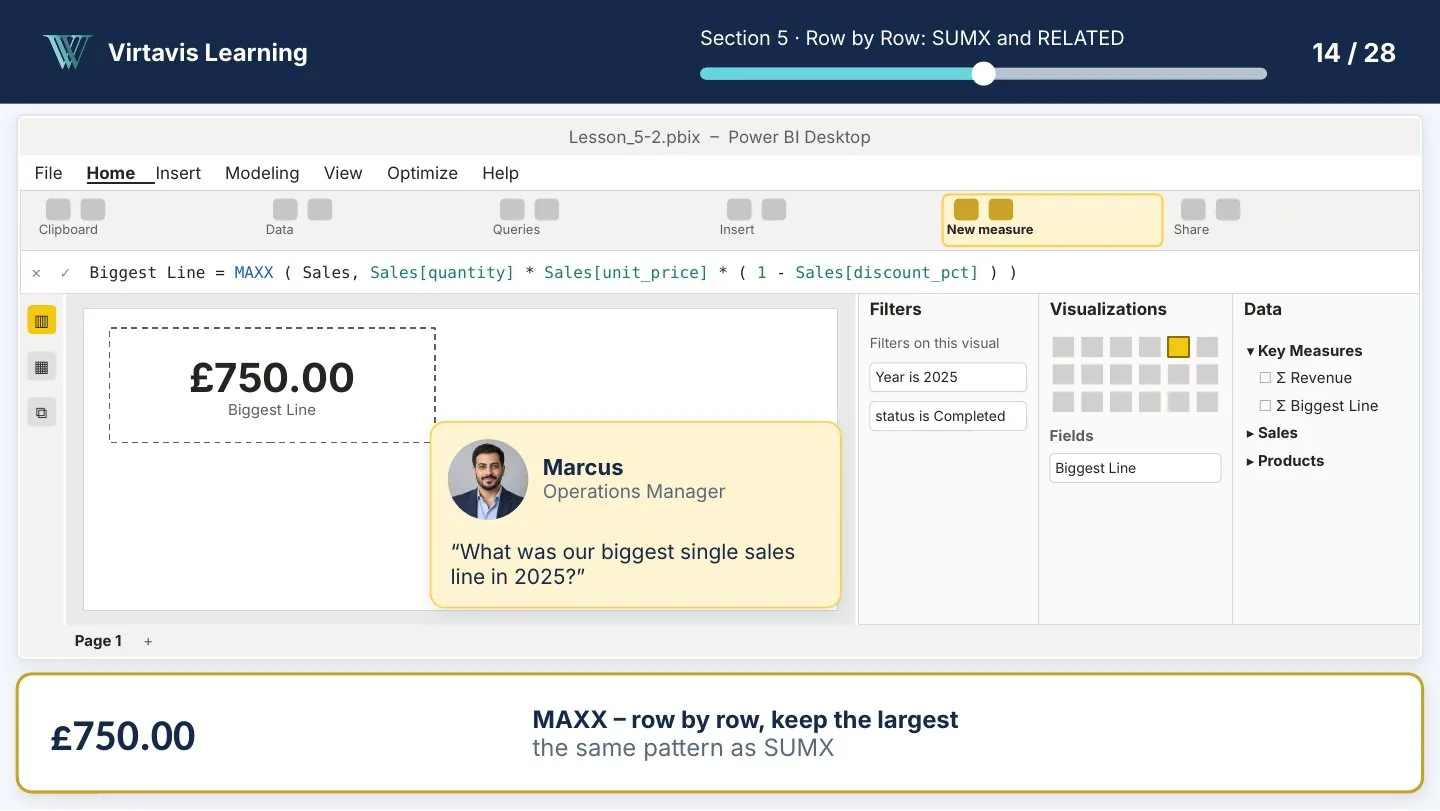
Write measures in plain English first, then in DAX, with SUMX, CALCULATE and filter context.
Compare with last year and with target, with year to date and running totals.
Plan the page, use themes and colour for meaning, add drill-through, bookmarks and AI visuals.
Check your report, set up row-level security and complete the board dashboard.
In Section 8 you build a complete report for Kettle & Bean: a cleaned, refreshable model, measures compared with last year and target, a drill-through page, row-level security and a check page. You finish with a one-page dashboard and three recommendations for the board.
See inside the course
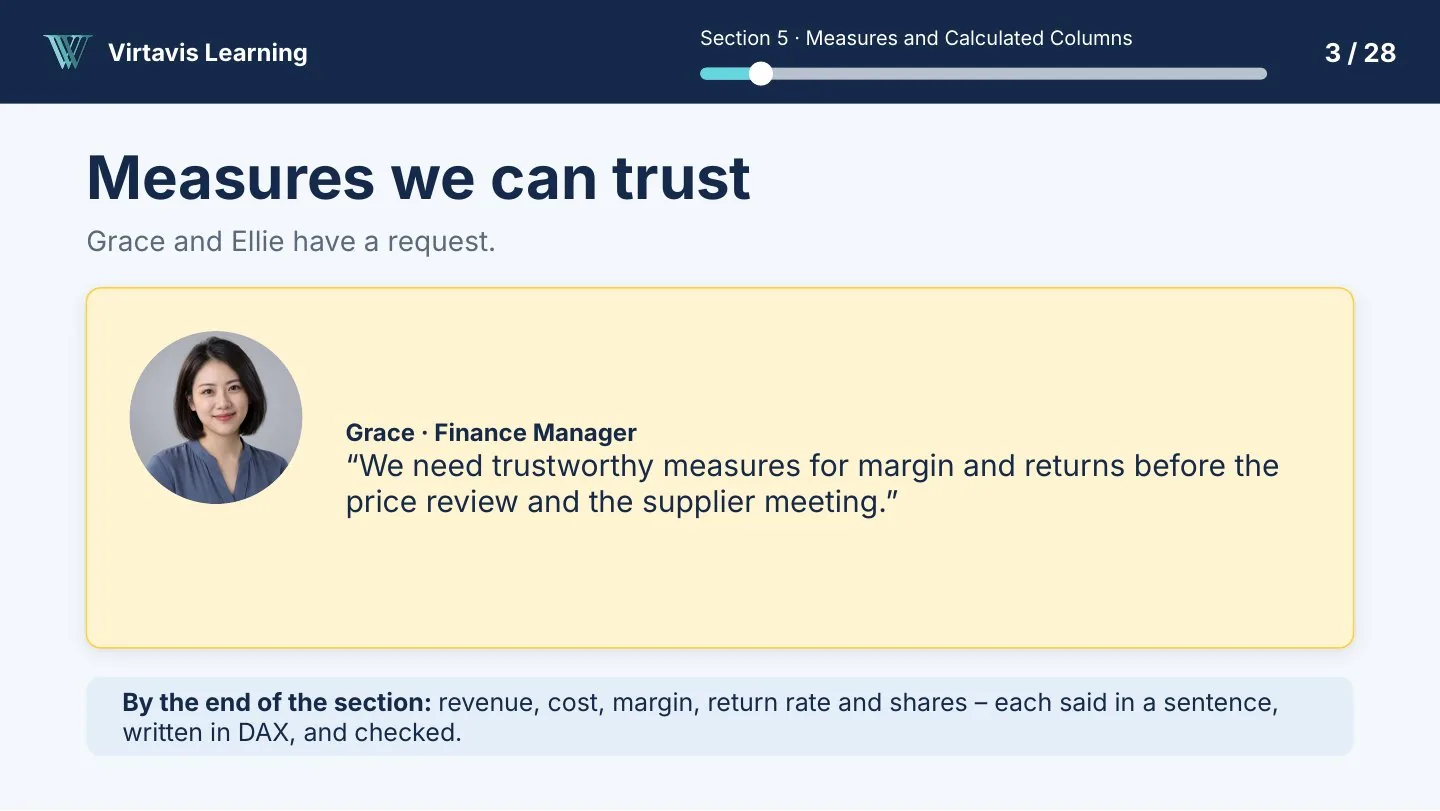
Explore slides from the actual lessons, including the live demonstrations. Click or tap any image to see it full size.
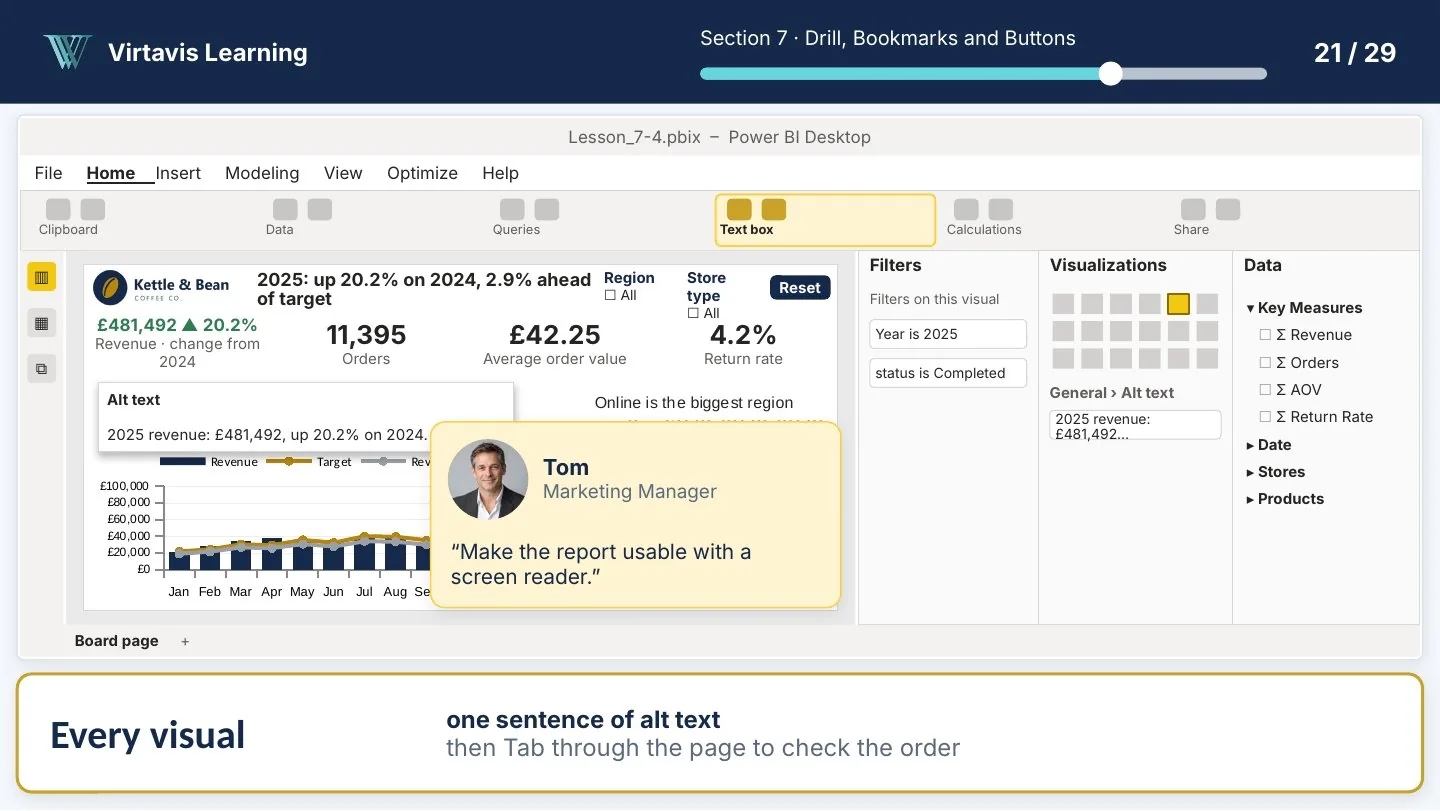
Kettle & Bean Co. is a fictional company created for teaching.
The learning scenario
Each lesson starts with a realistic request from a colleague at a fictional UK coffee and tea retailer. You query the data, check the result and explain what it shows.
 Amara
 Priya
 Grace
 Marcus
 Tom
 Ellie

Created by Virtavis Learning
Data and Business Intelligence Specialist, founder of Virtavis Learning
Sophie Lumpa created this course and designed the Kettle & Bean learning scenario, bringing realistic business questions into the learning experience. The Virtavis teaching team provides additional training and learner support through the Bootcamp and live cohorts.
On the pathway
Questions
If your question isn't answered here, send it to us and the Virtavis team will reply by email.
Contact us ›See how the lessons work before you choose.